Chart gallery
This page shows every public chart type in three documentation modes:
Color: the chart rendered with ANSI color and Unicode enabled
Greyscale: the chart rendered through the same pipeline with ANSI colors remapped to a greyscale palette for print and accessibility review
Monochrome: the chart rendered without ANSI color and with ASCII-safe characters
The screenshots are generated from the library itself by
scripts/generate_doc_screenshots.py and stored under
docs/_static/screenshots/.
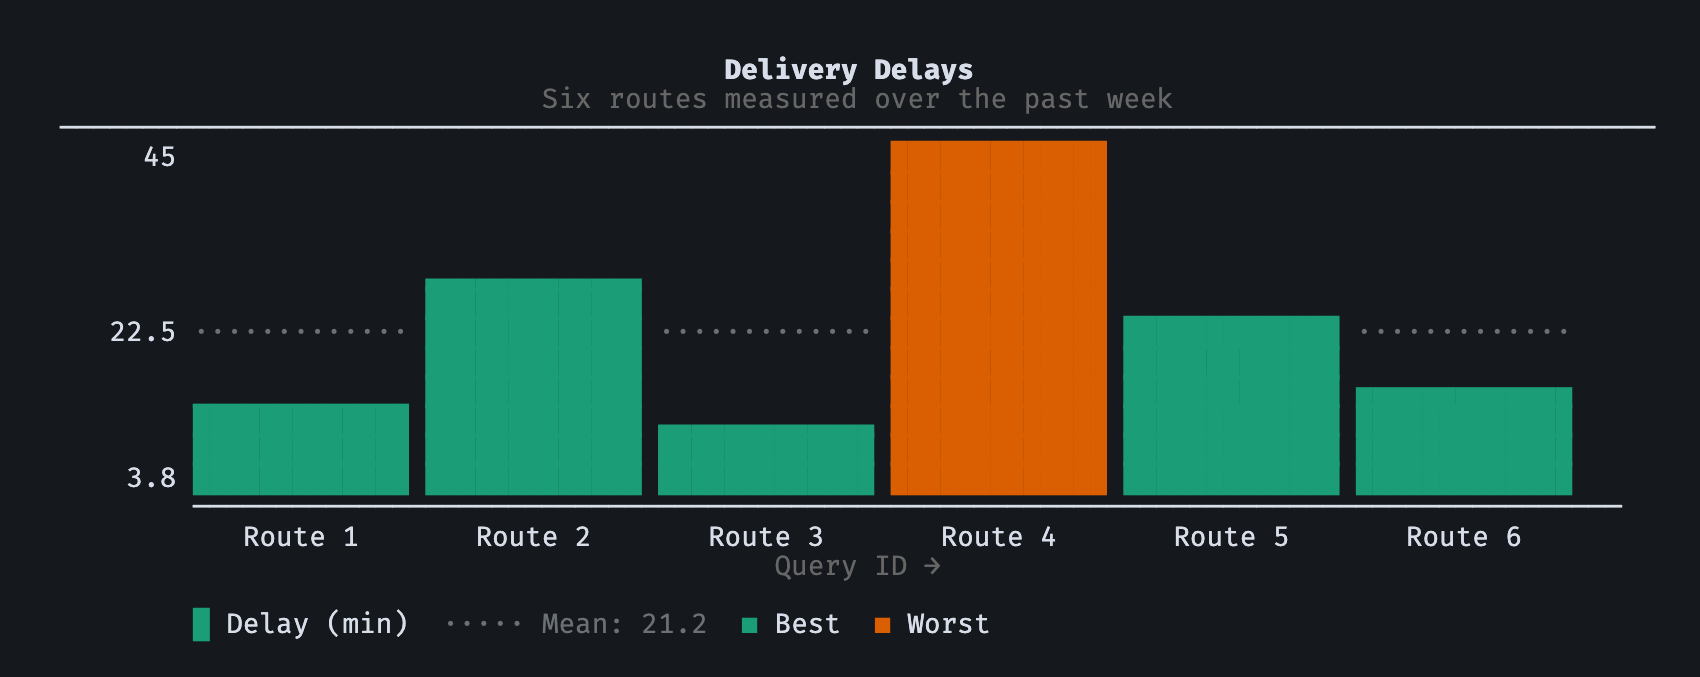
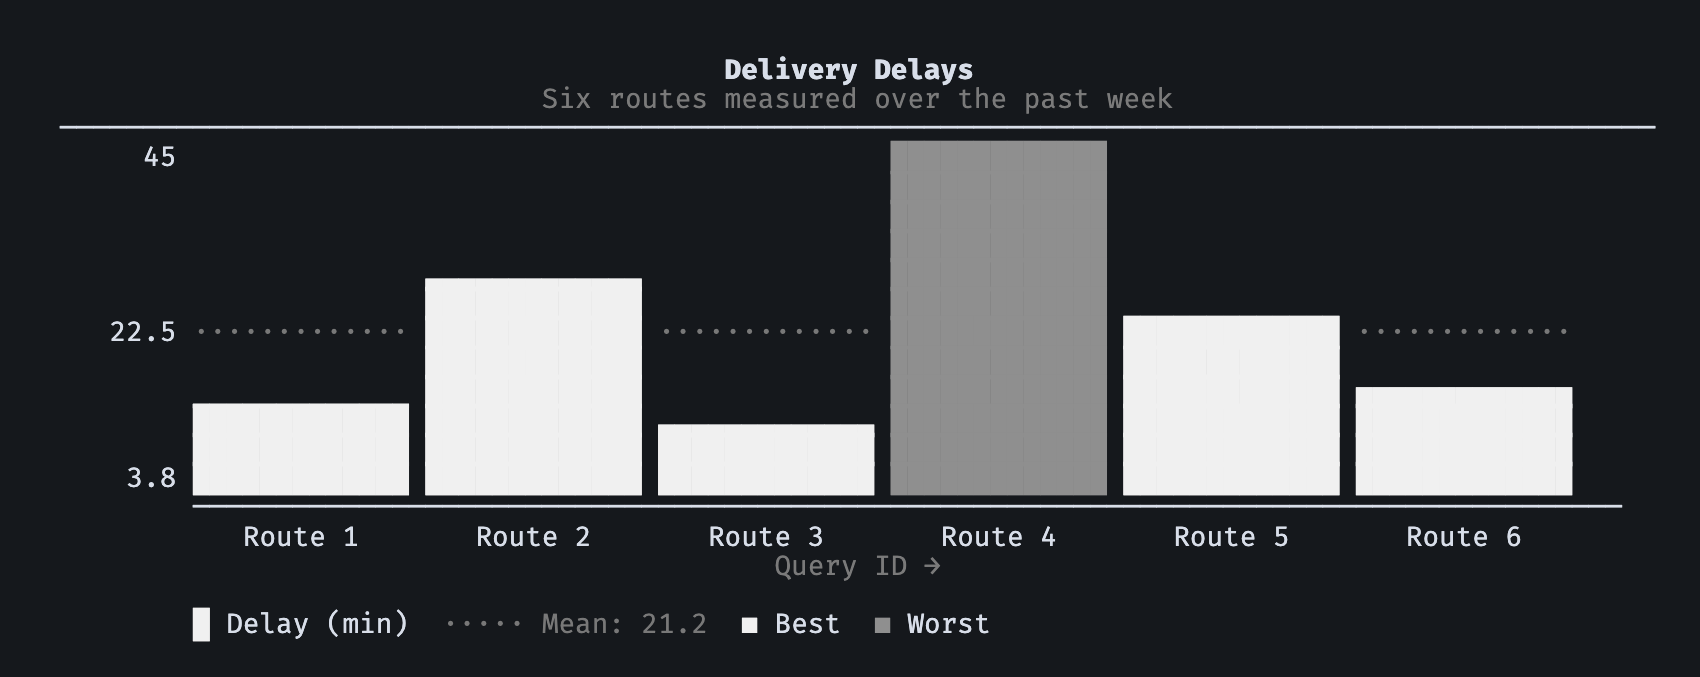
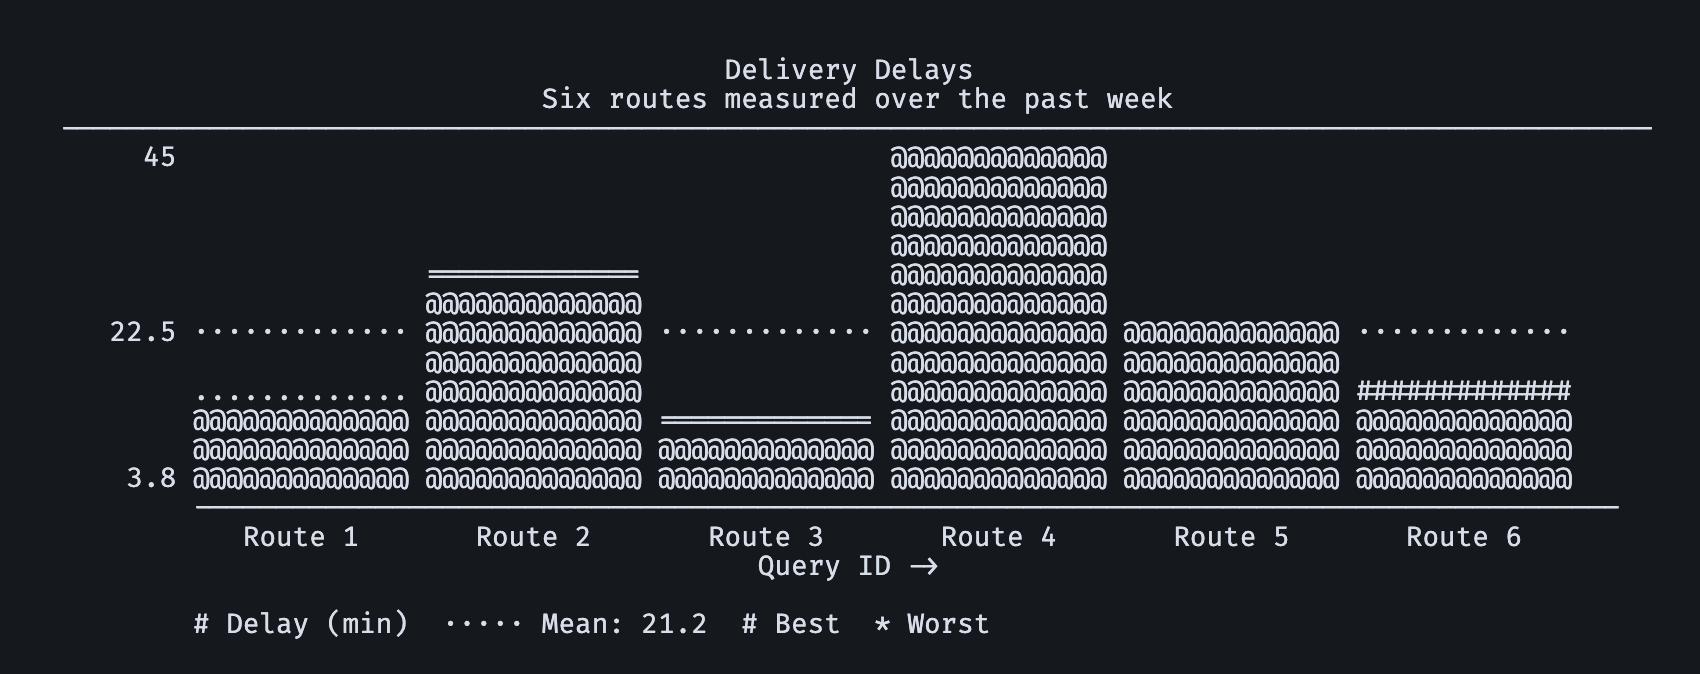
BarChart
Color
Greyscale
Monochrome
Histogram
Color
Greyscale
Monochrome
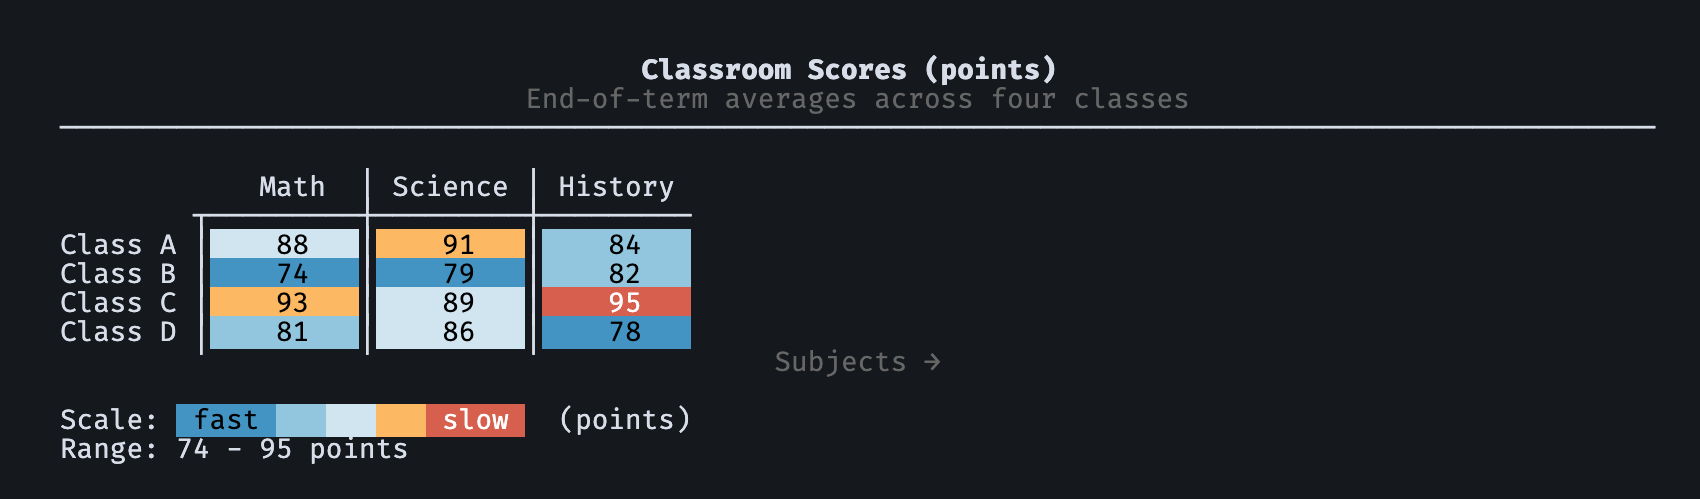
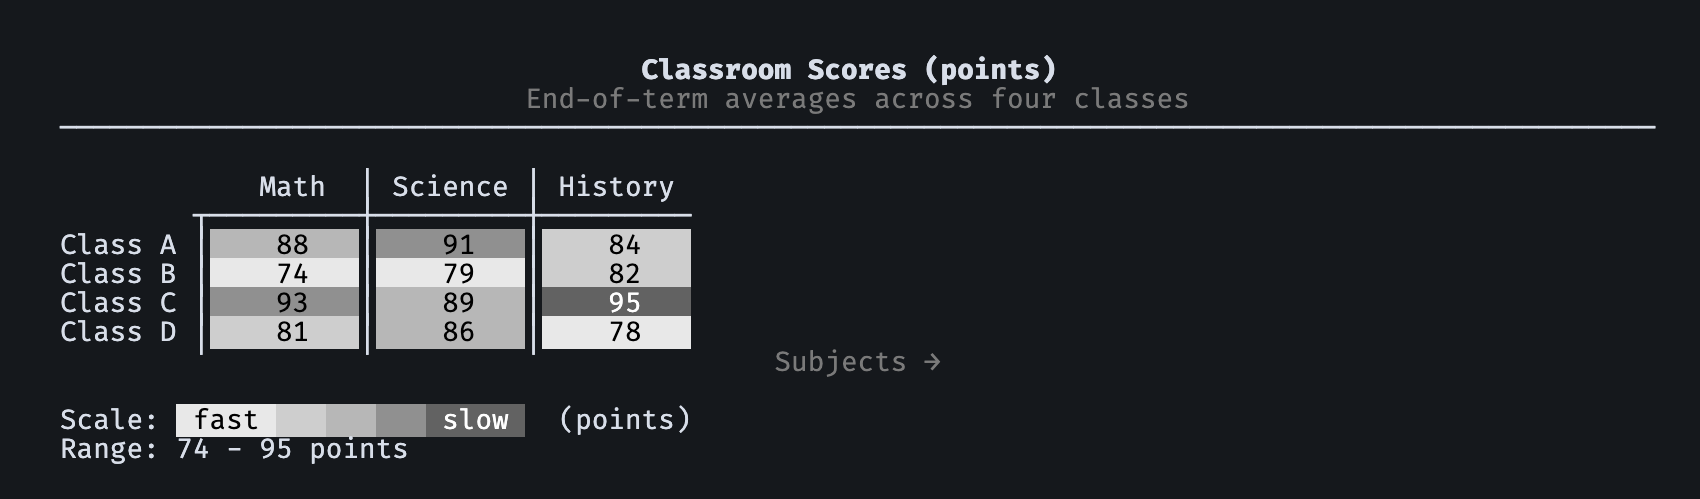
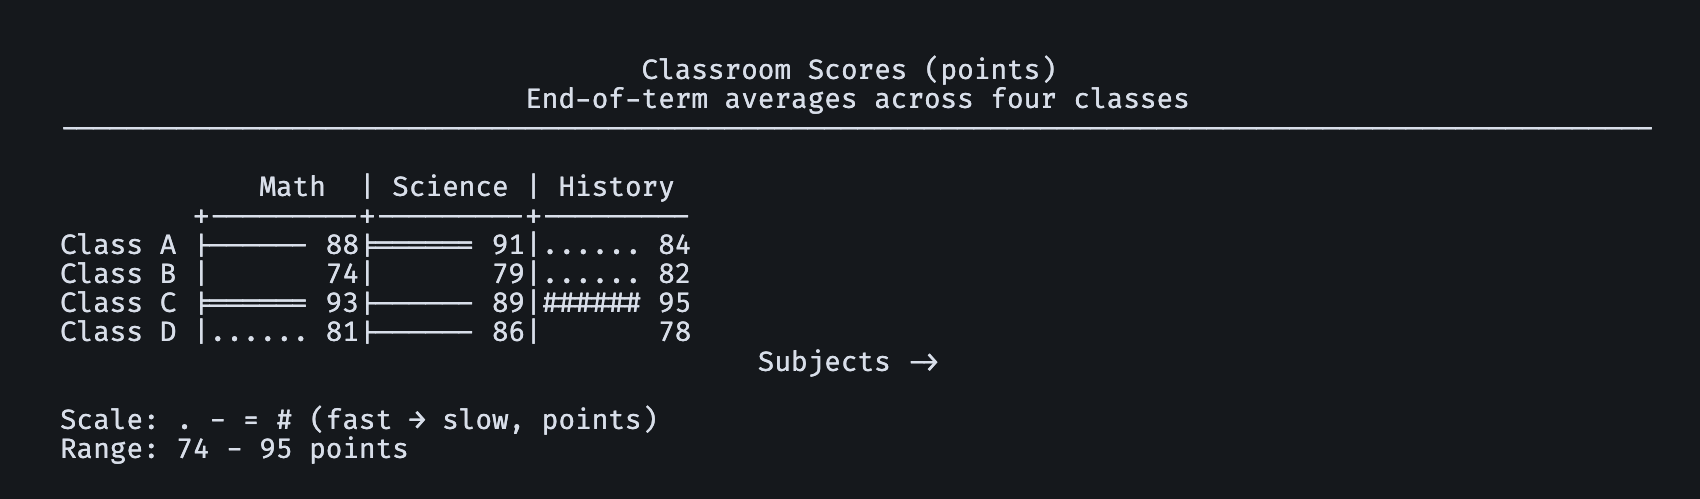
Heatmap
Color
Greyscale
Monochrome
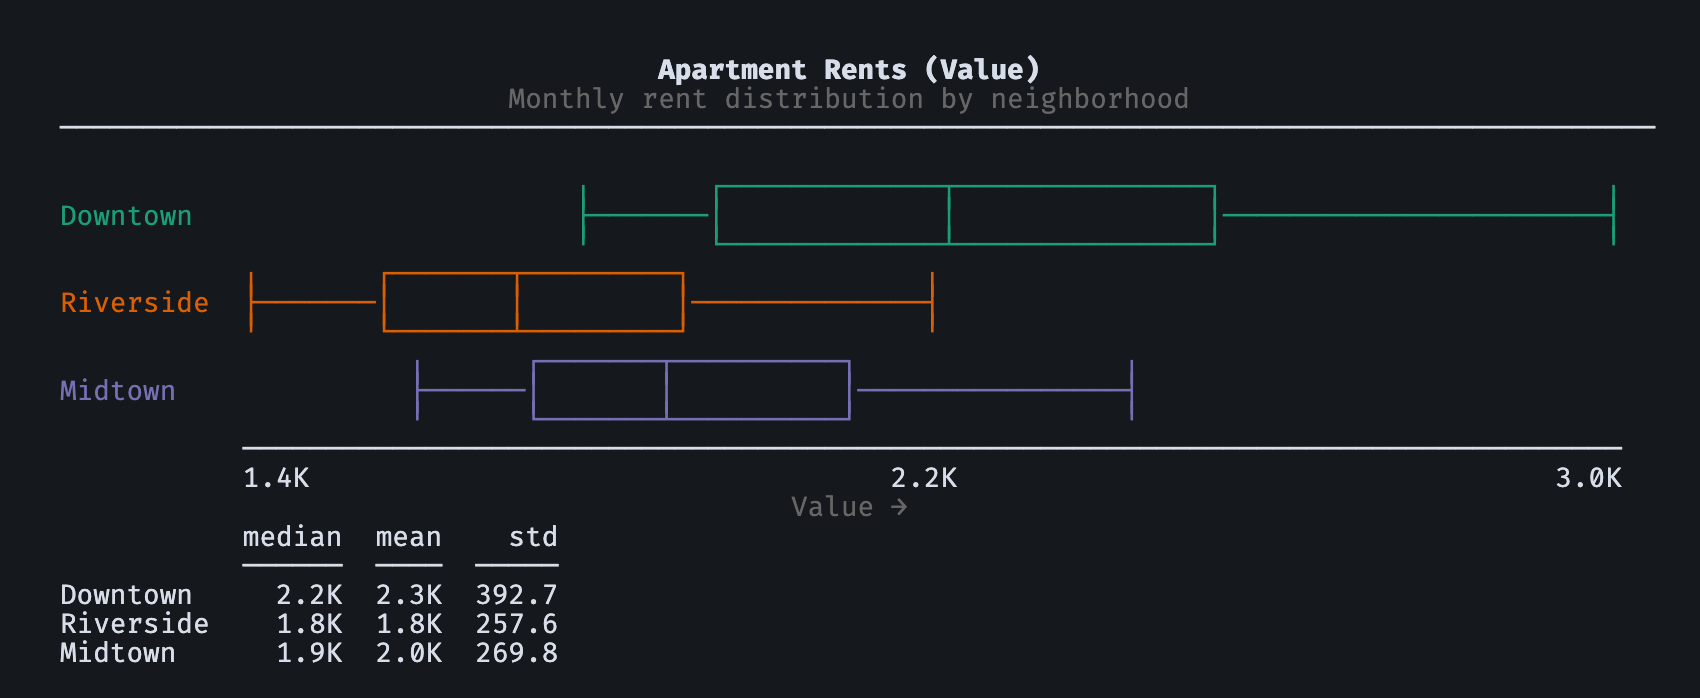
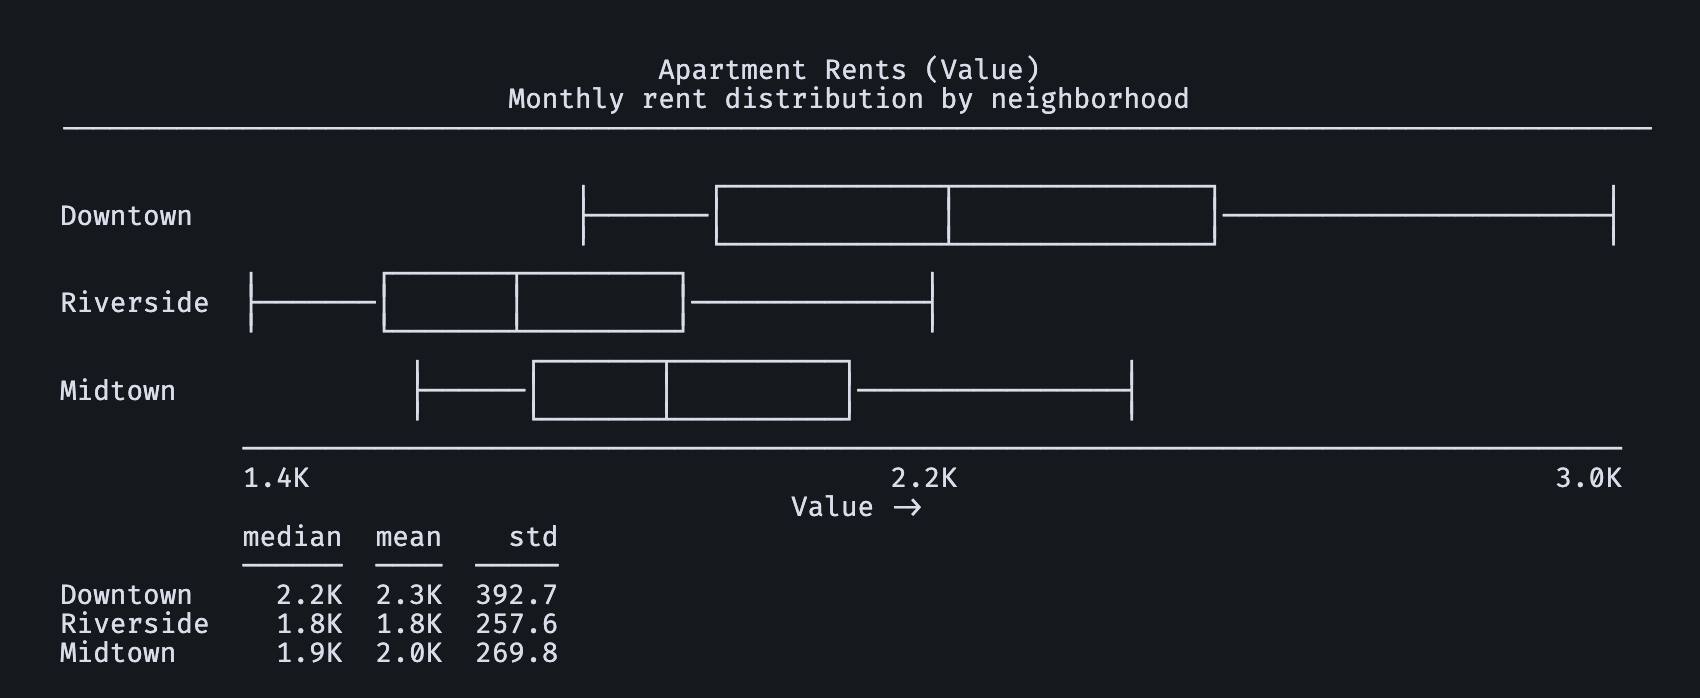
BoxPlot
Color
Greyscale
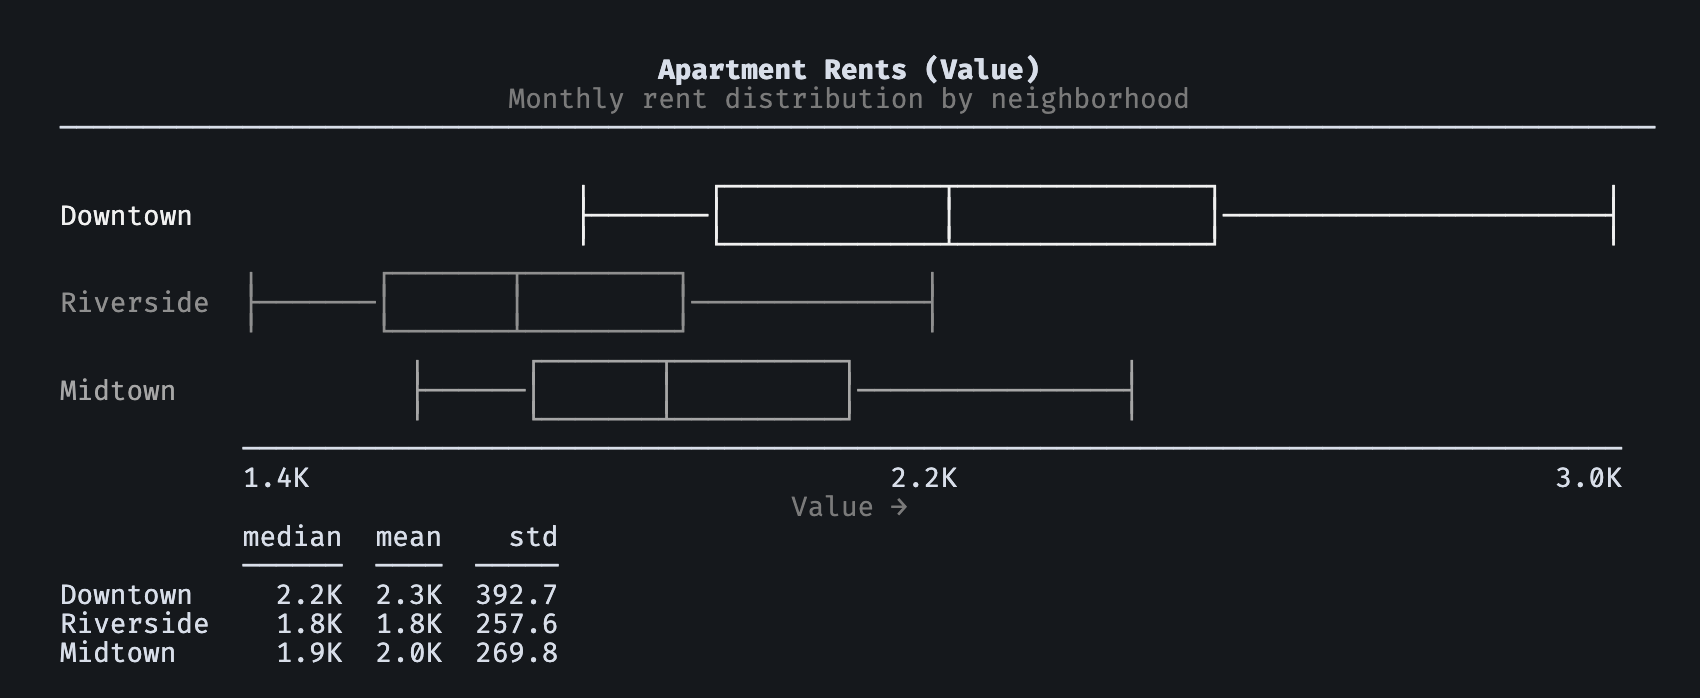
Monochrome
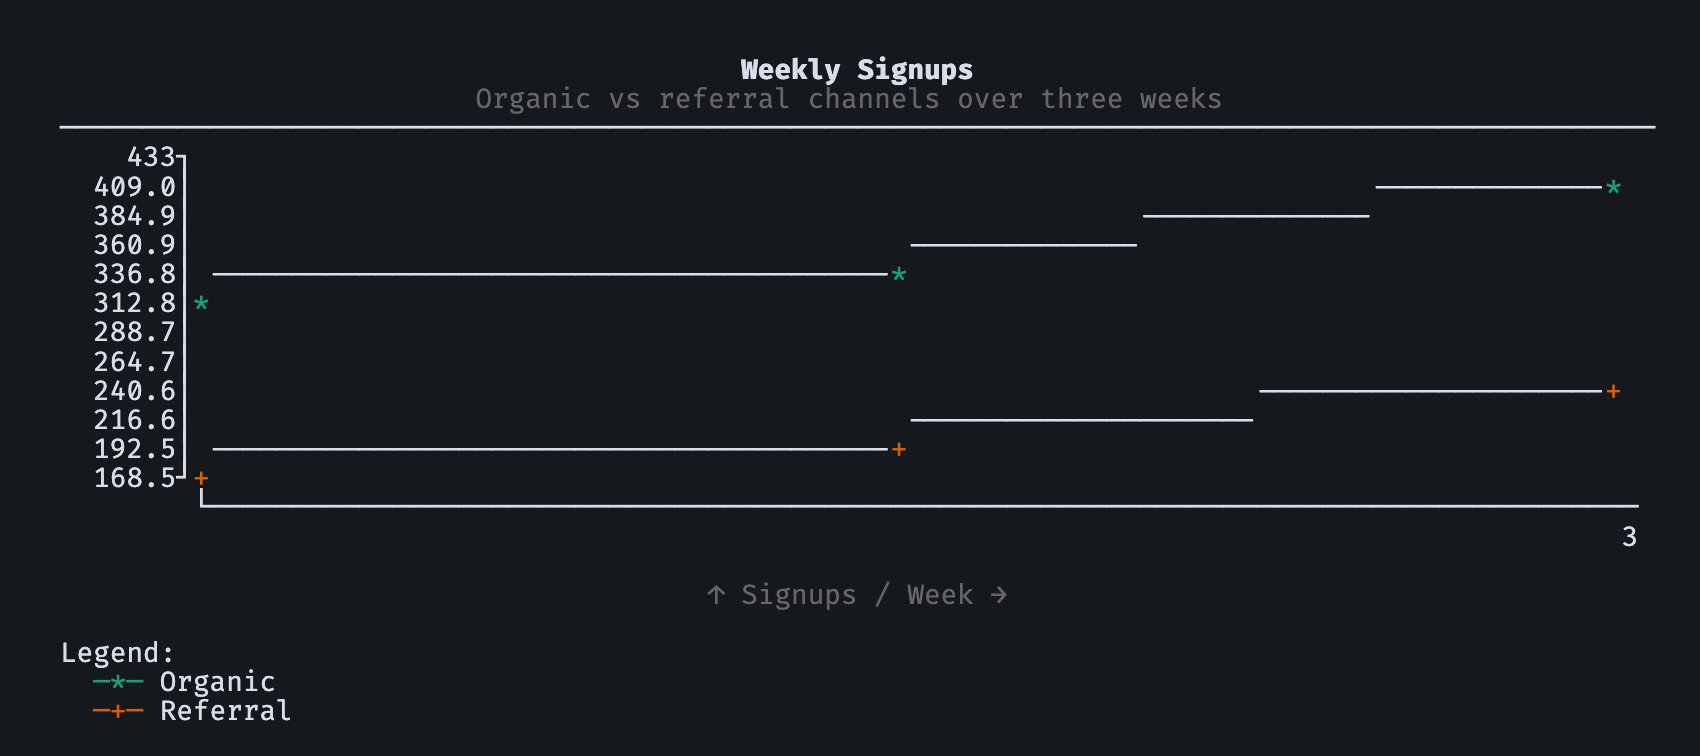
LineChart
Color
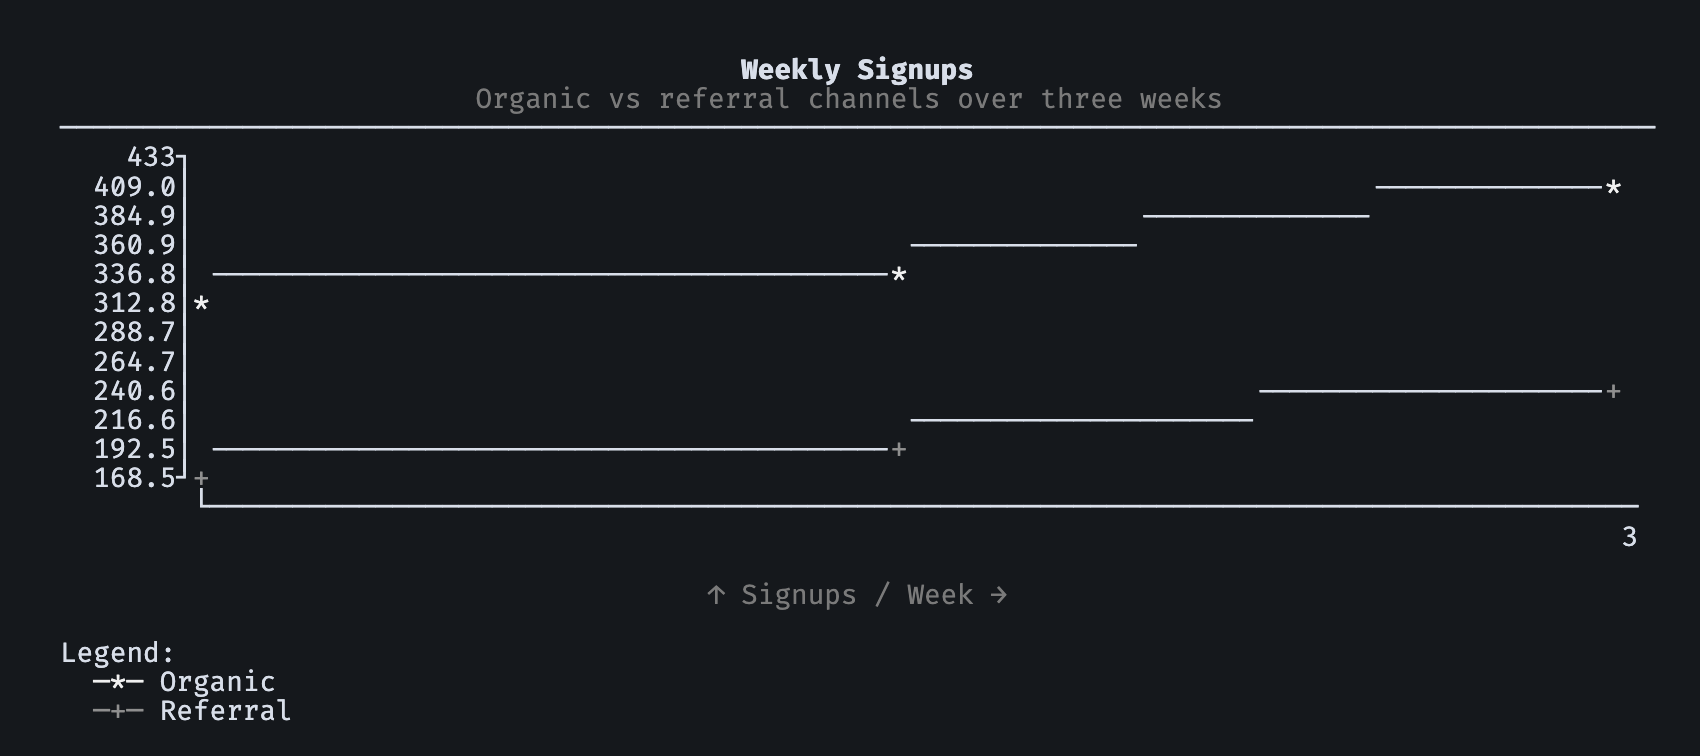
Greyscale
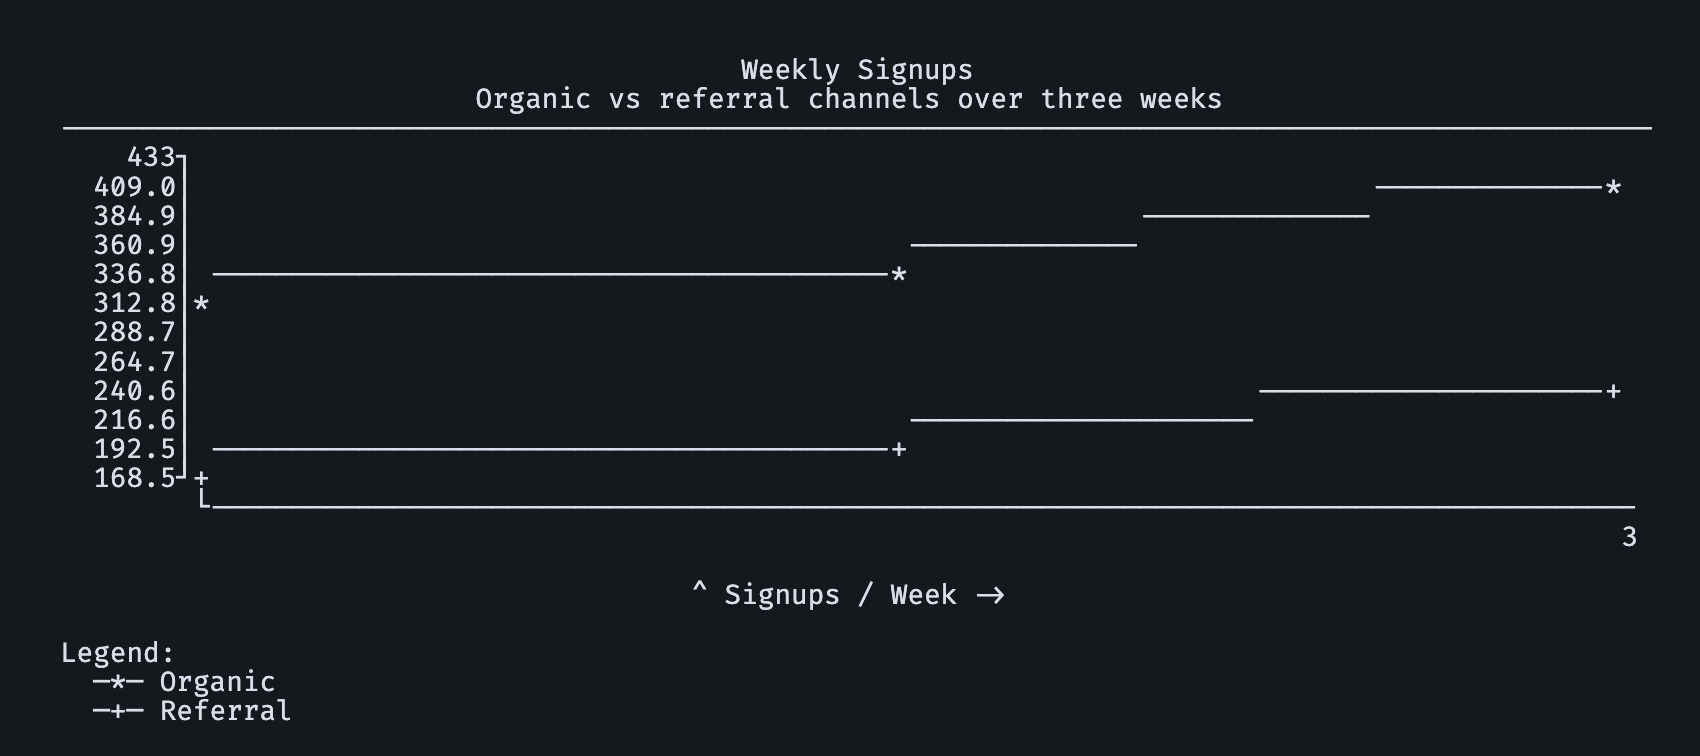
Monochrome
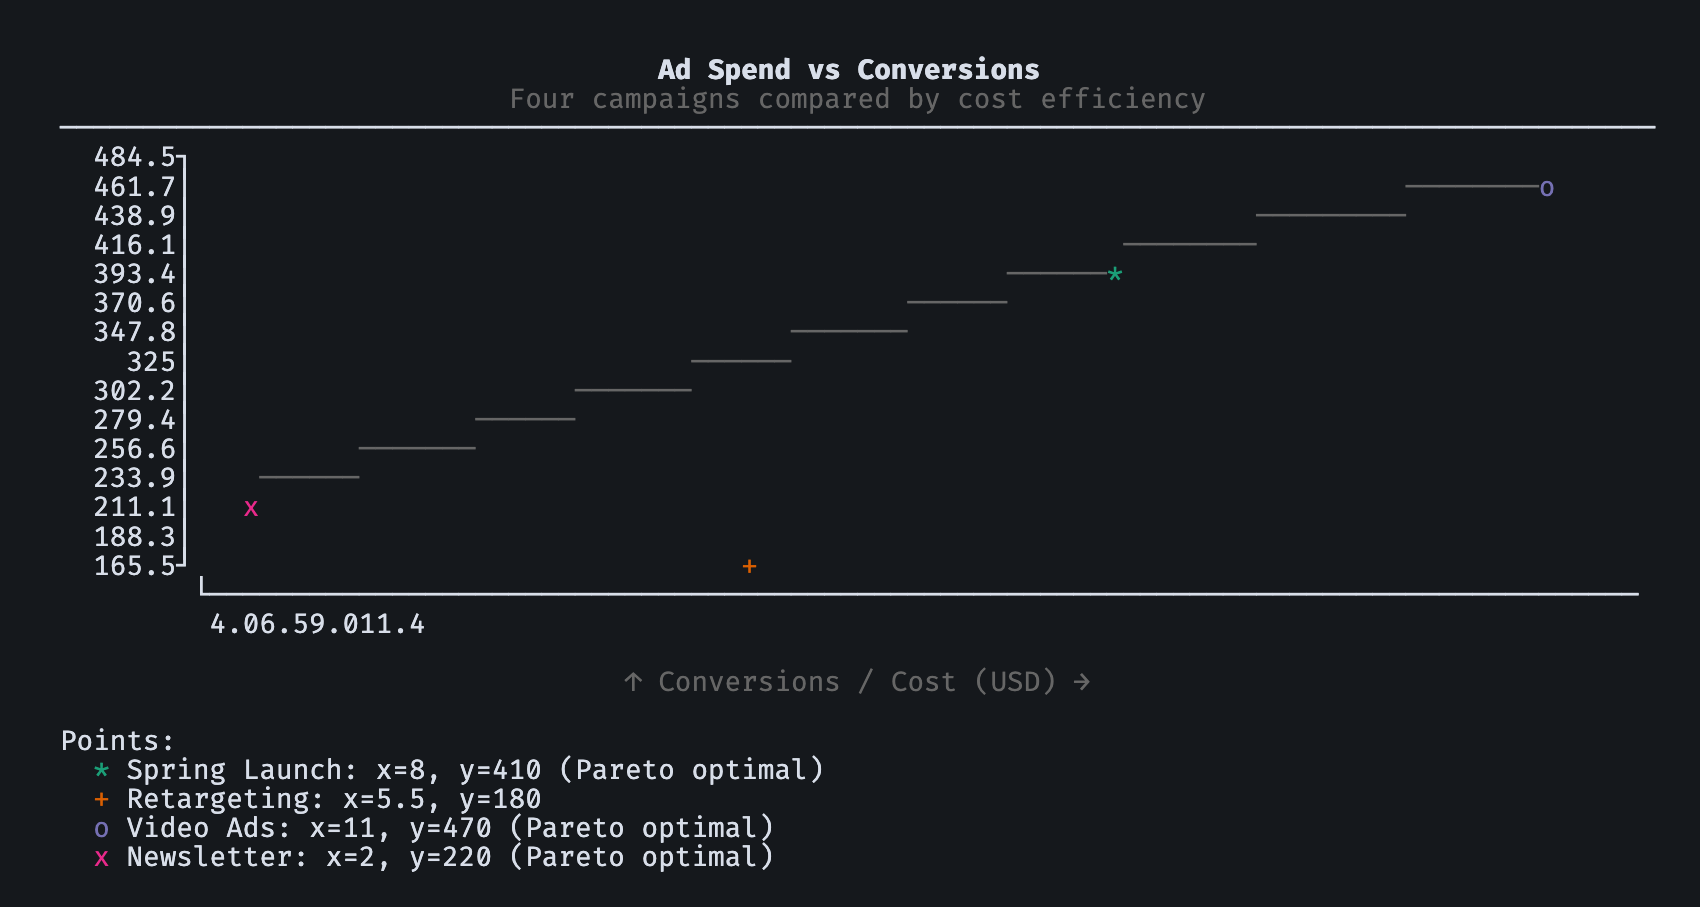
ScatterPlot
Color
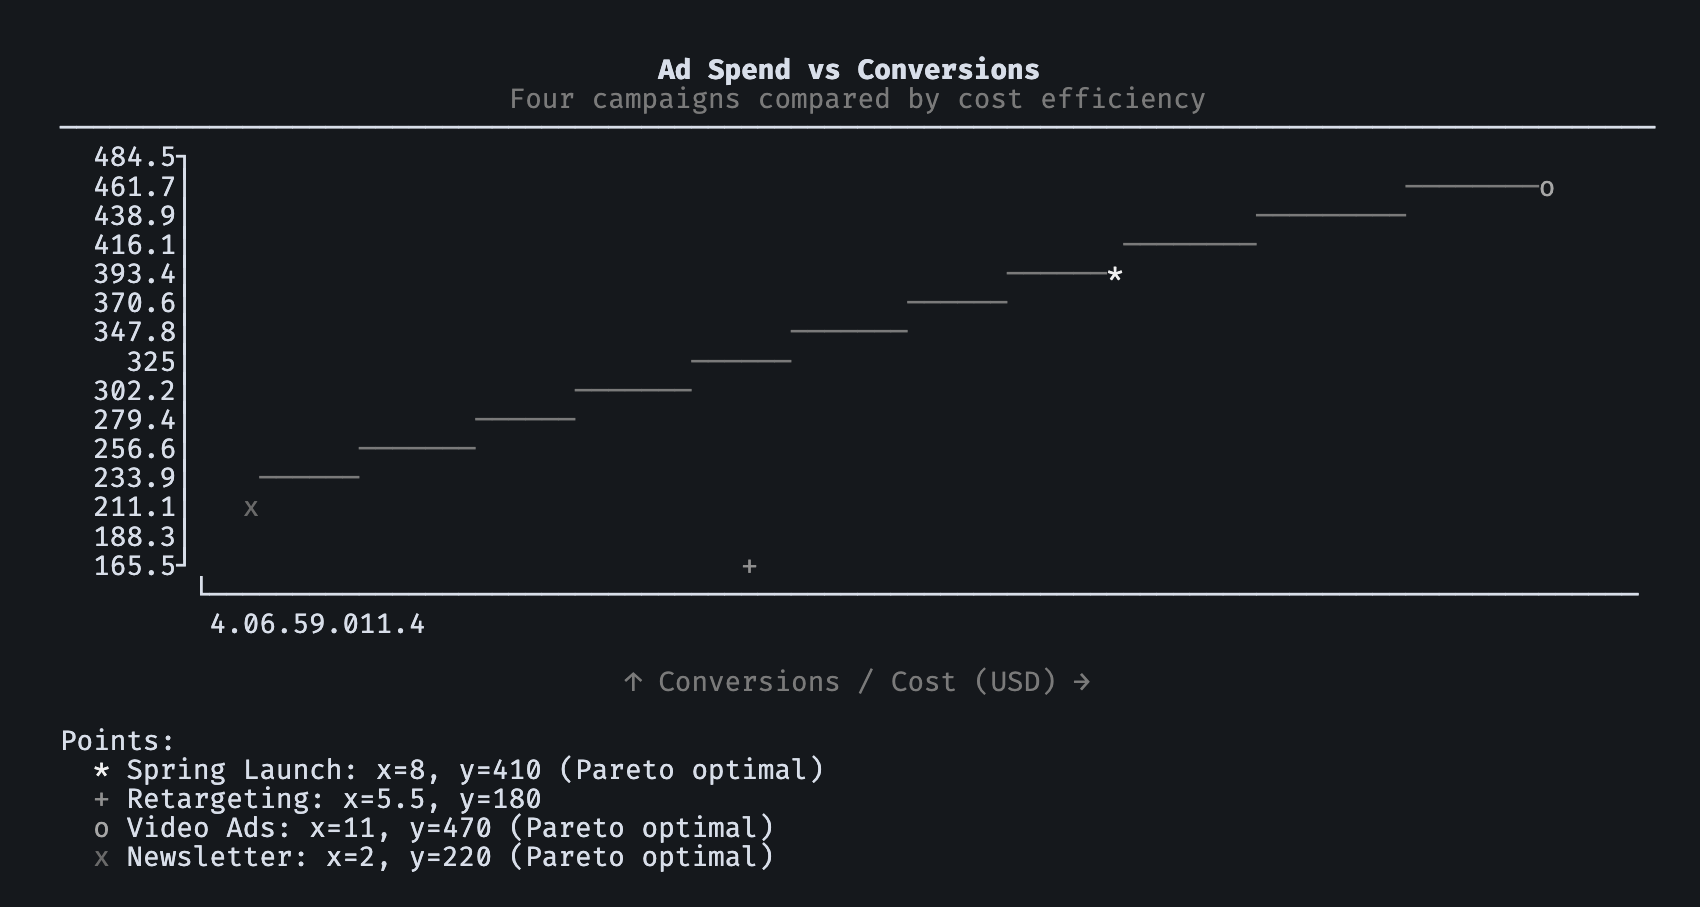
Greyscale
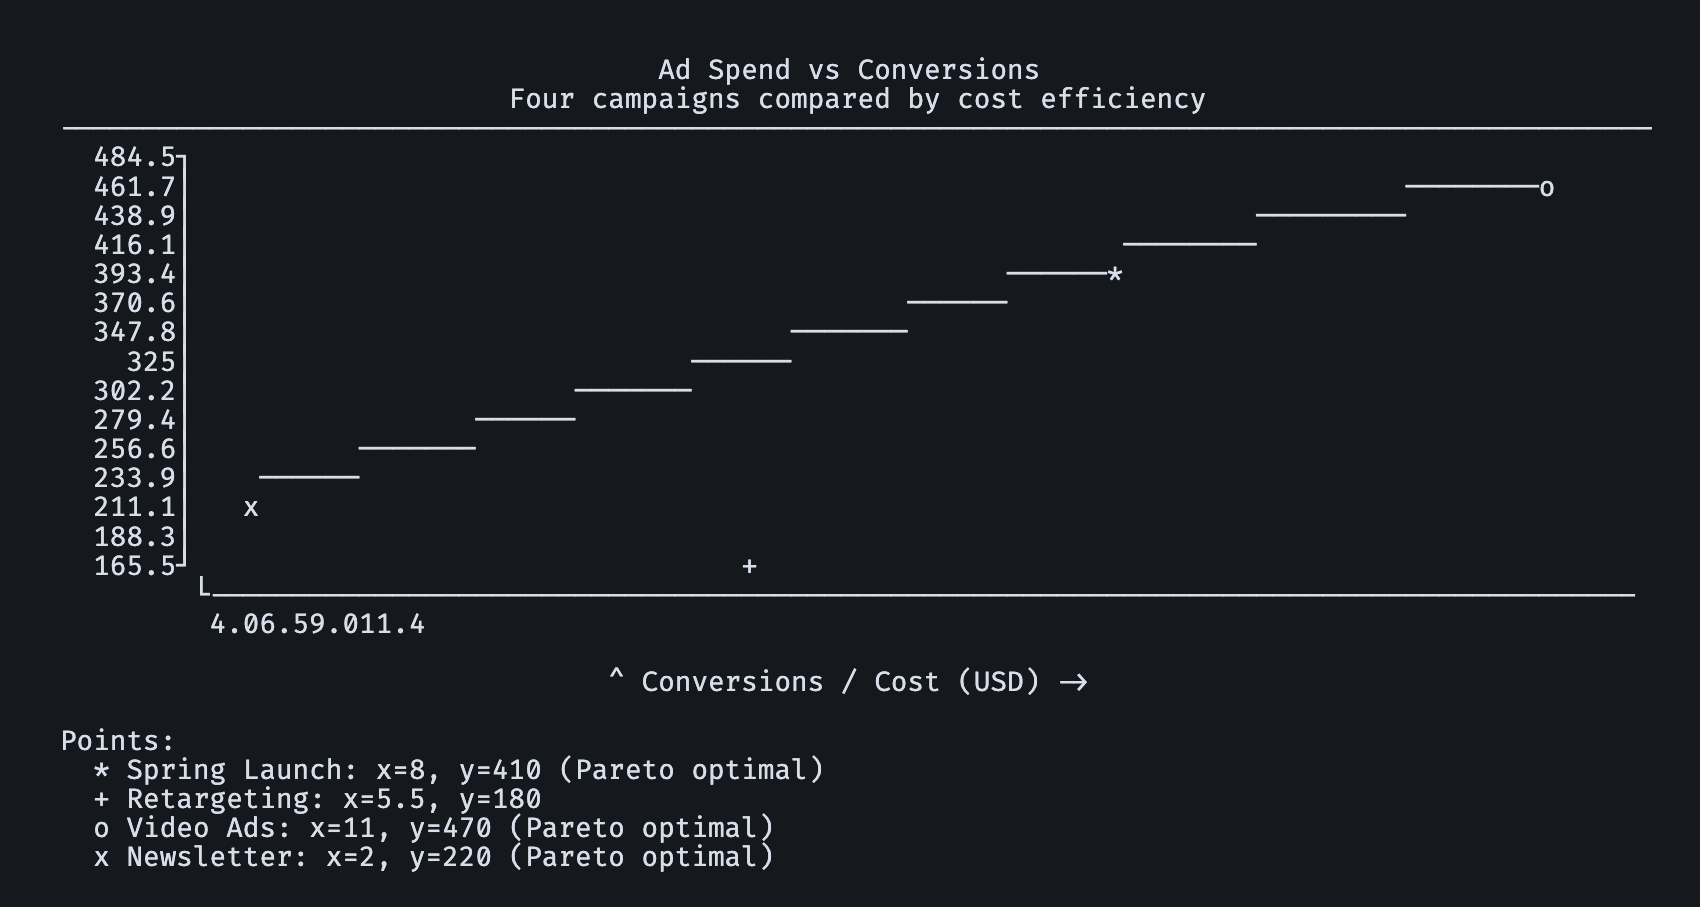
Monochrome
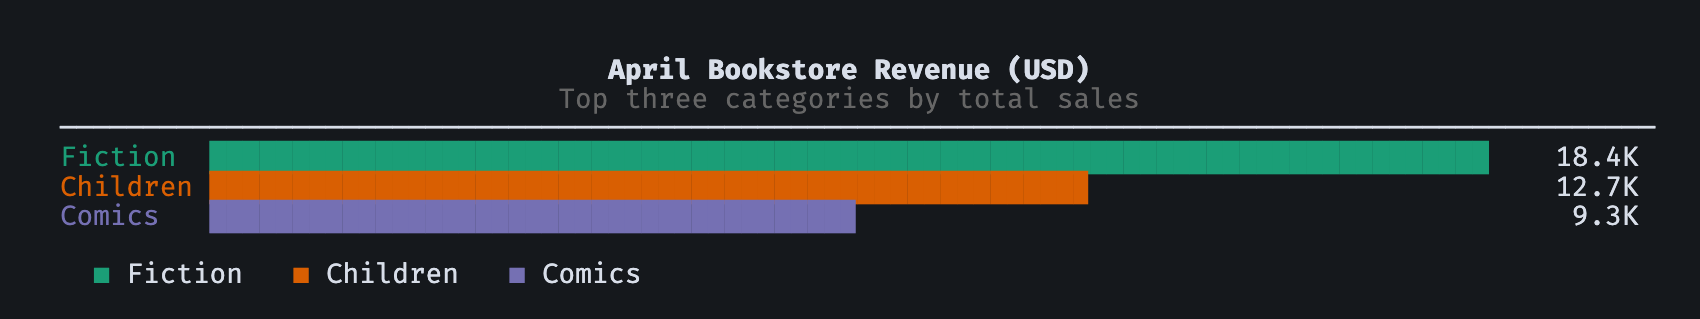
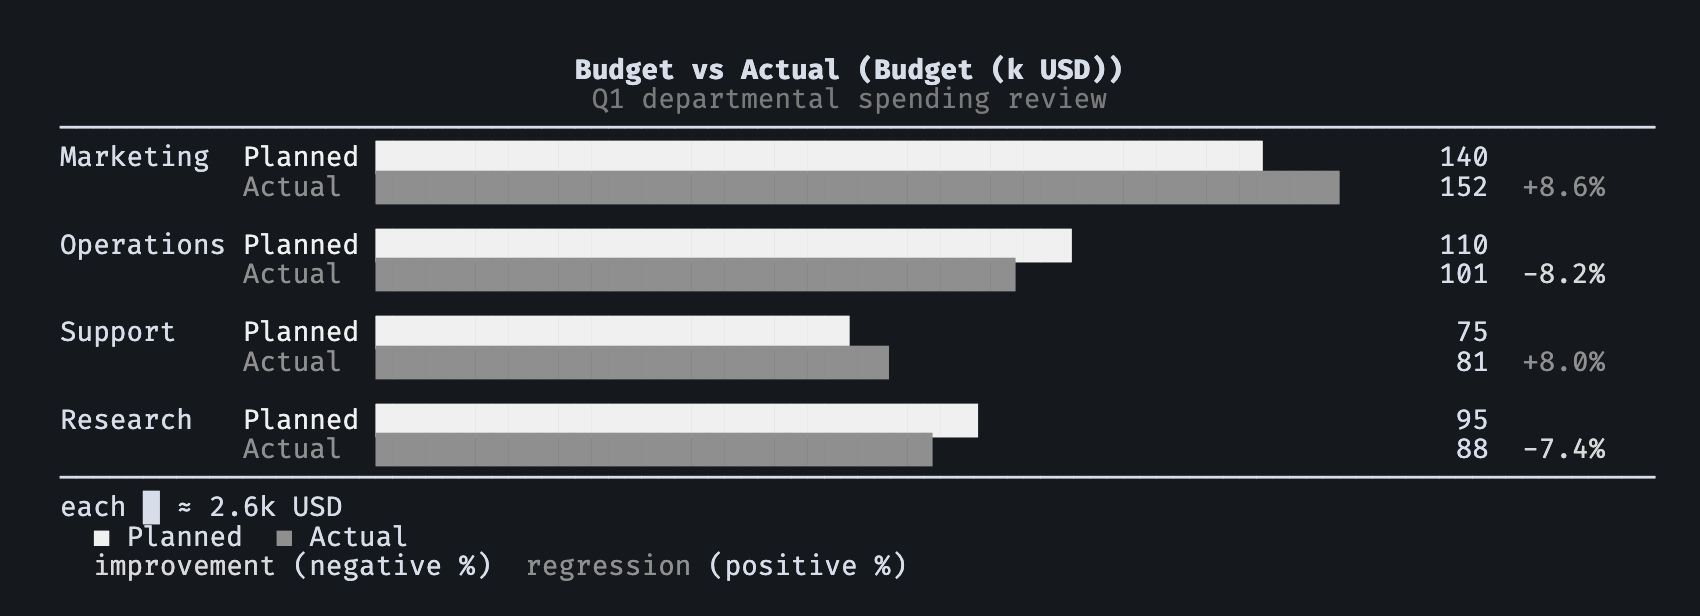
ComparisonBar
Color
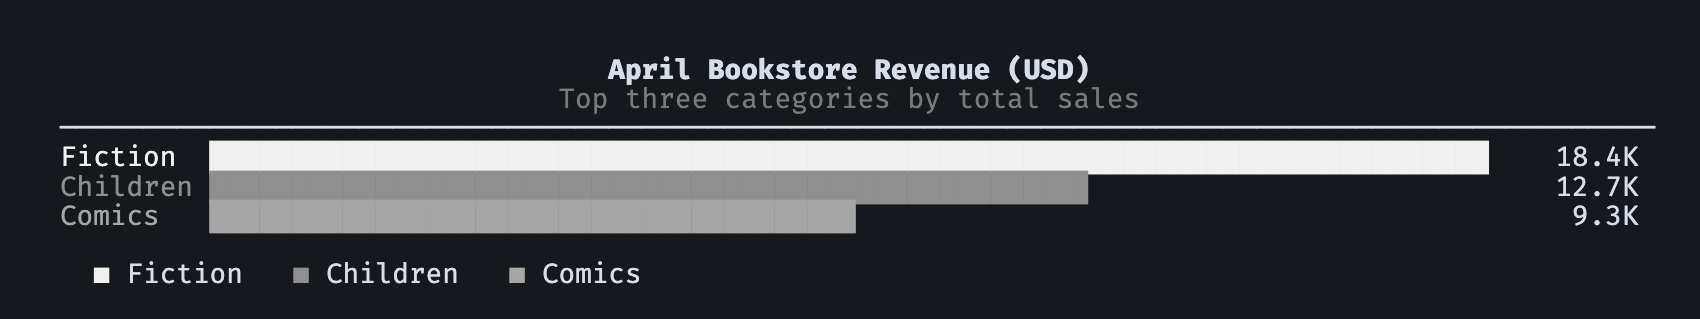
Greyscale
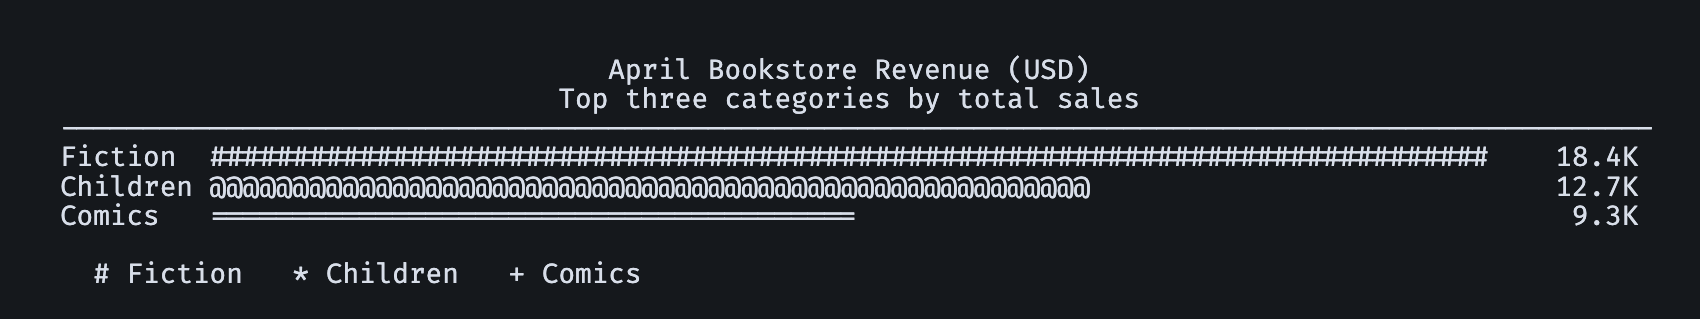
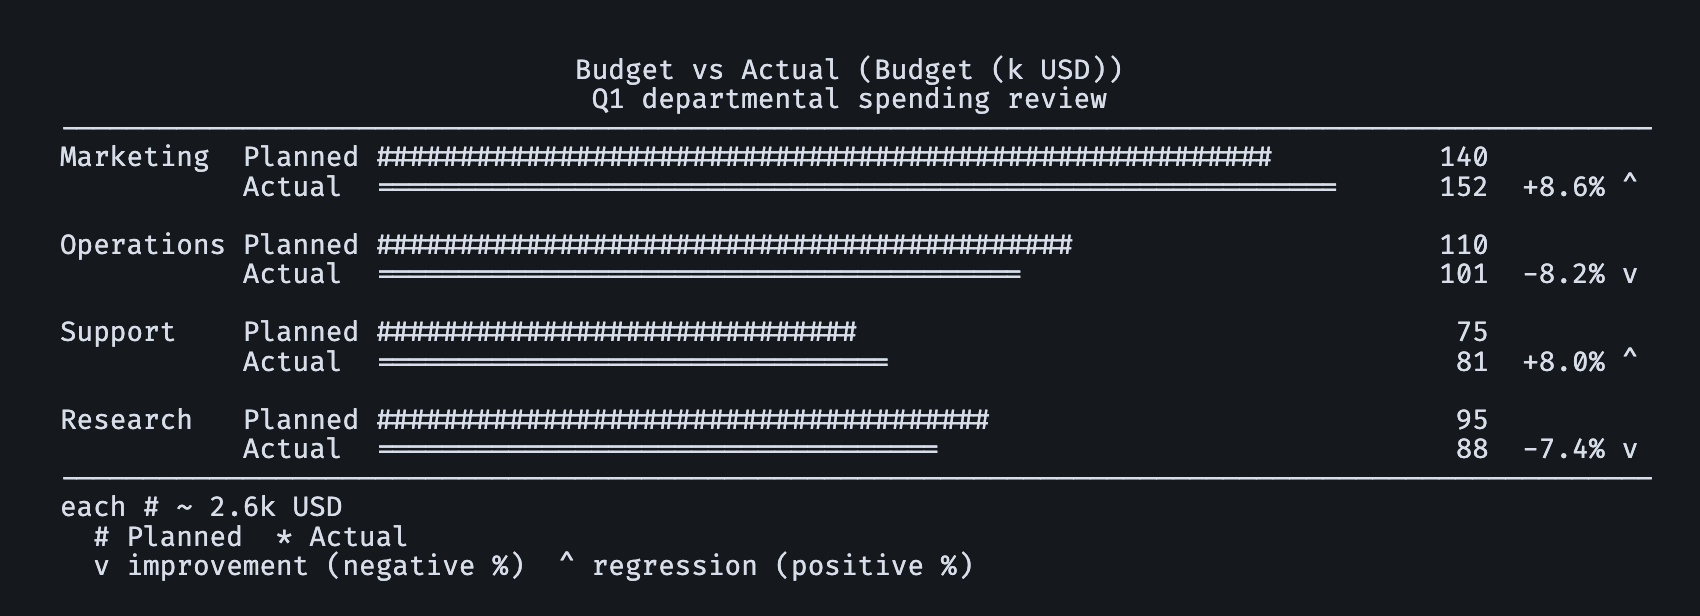
Monochrome
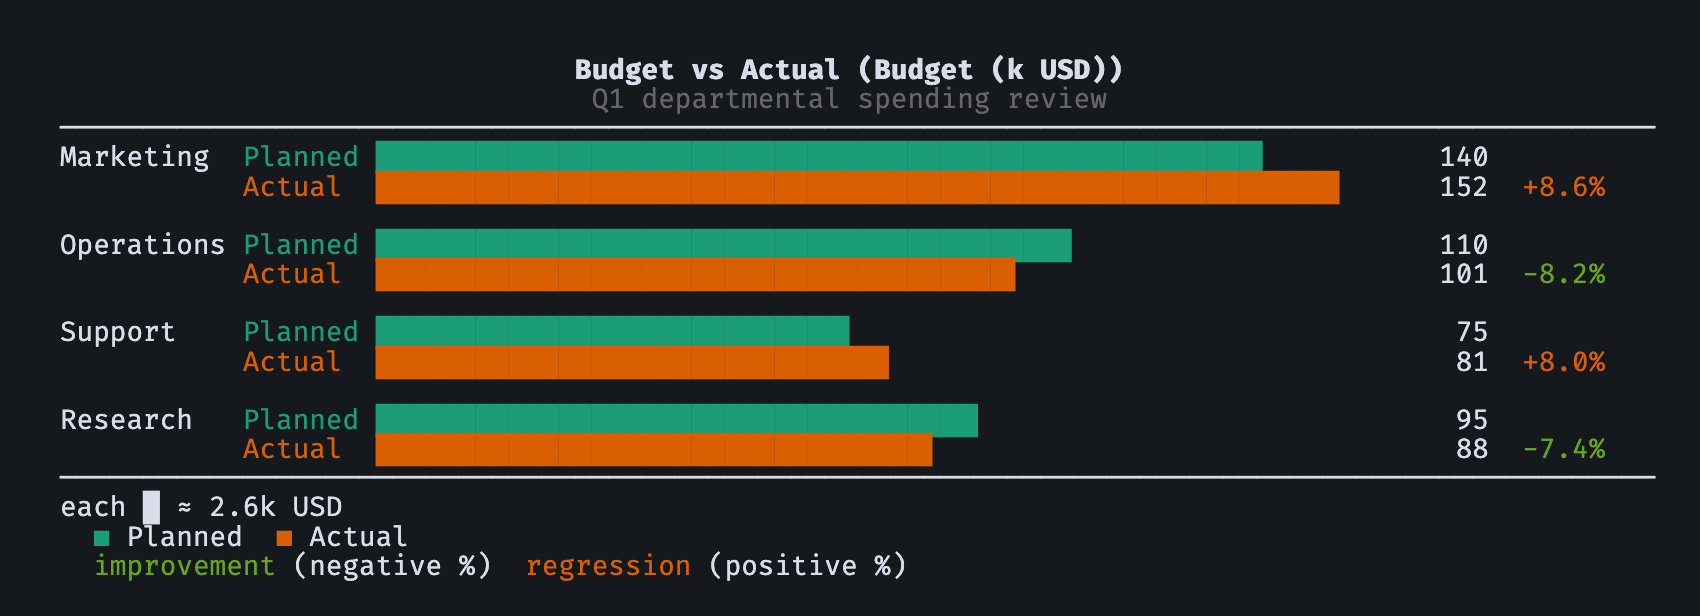
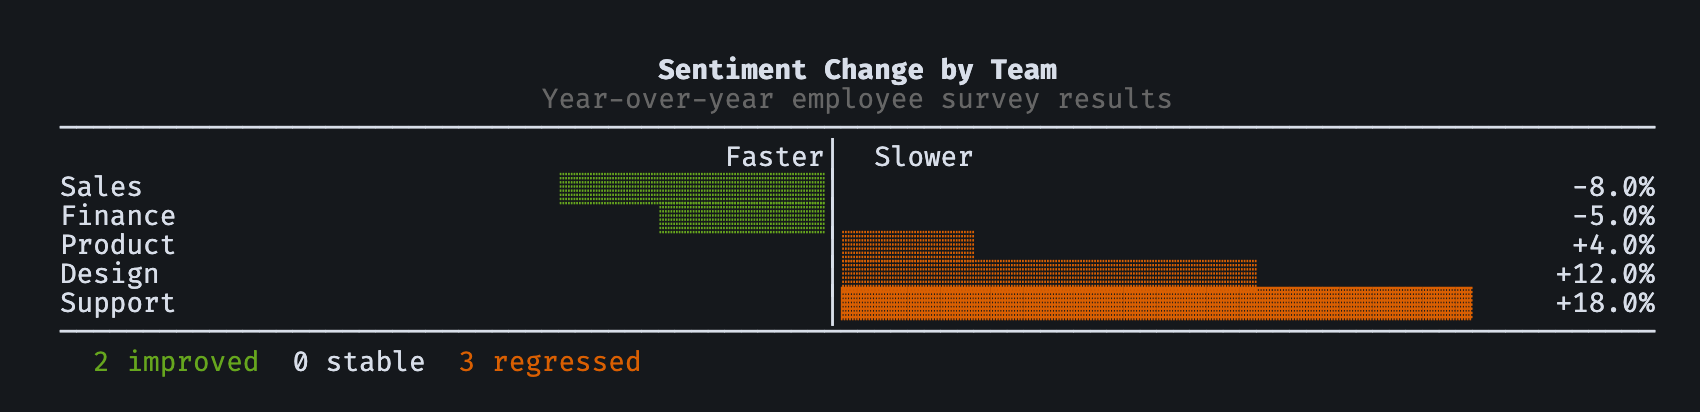
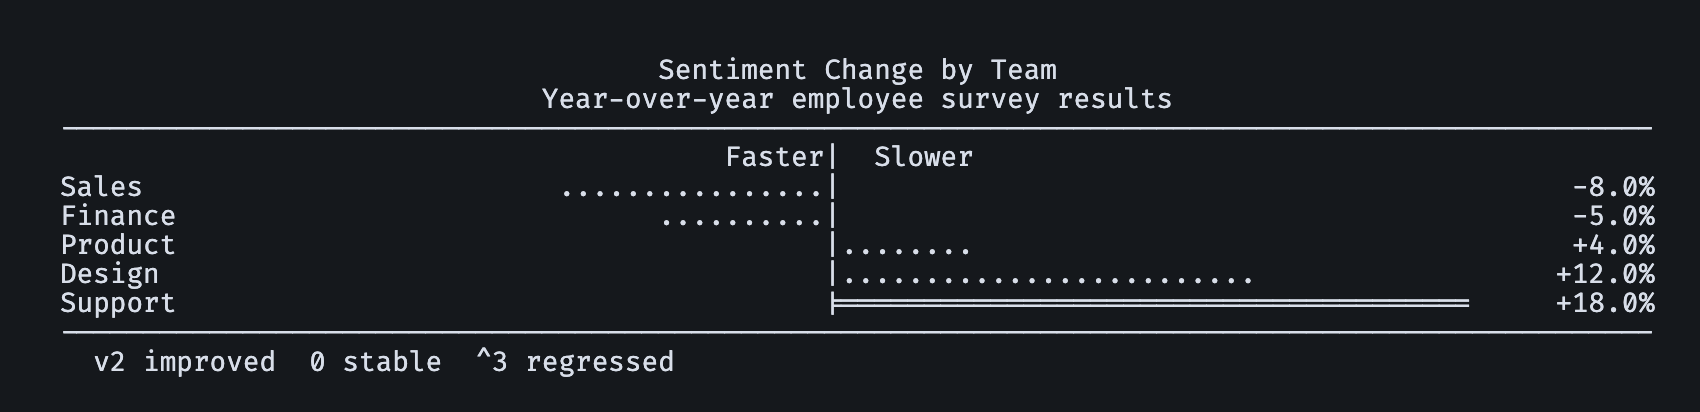
DivergingBar
Color
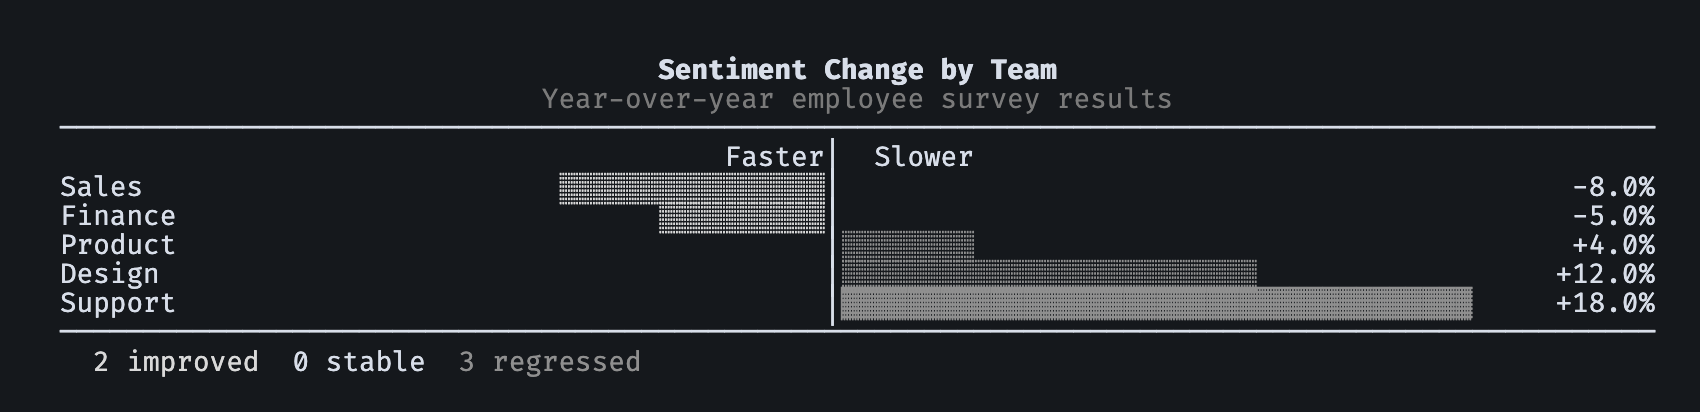
Greyscale
Monochrome
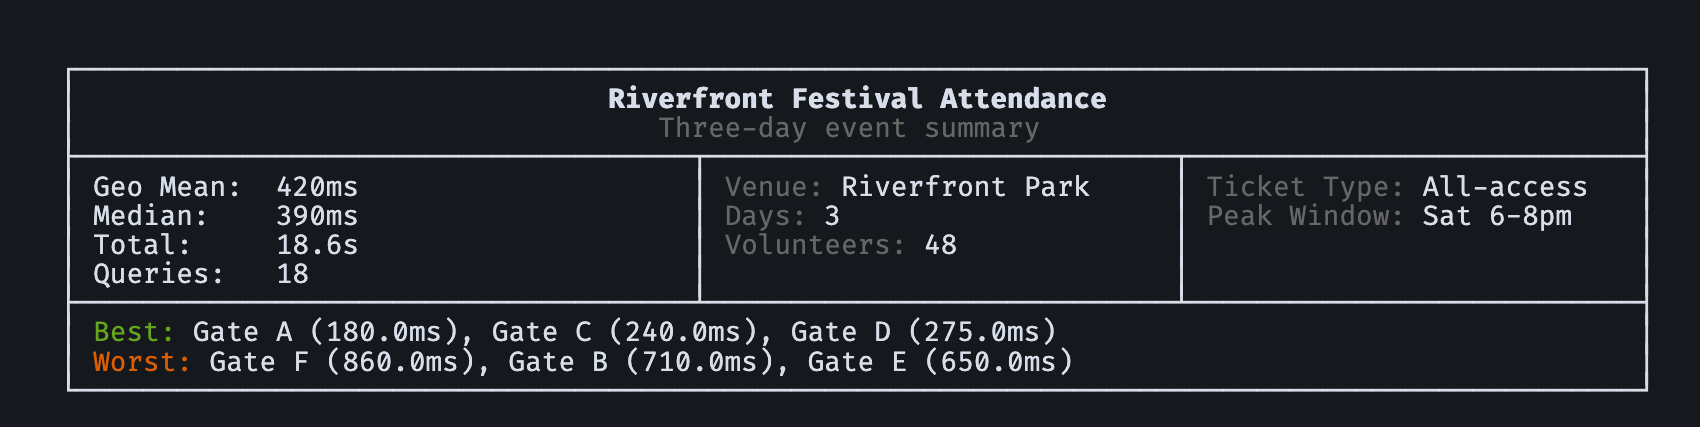
SummaryBox
Color
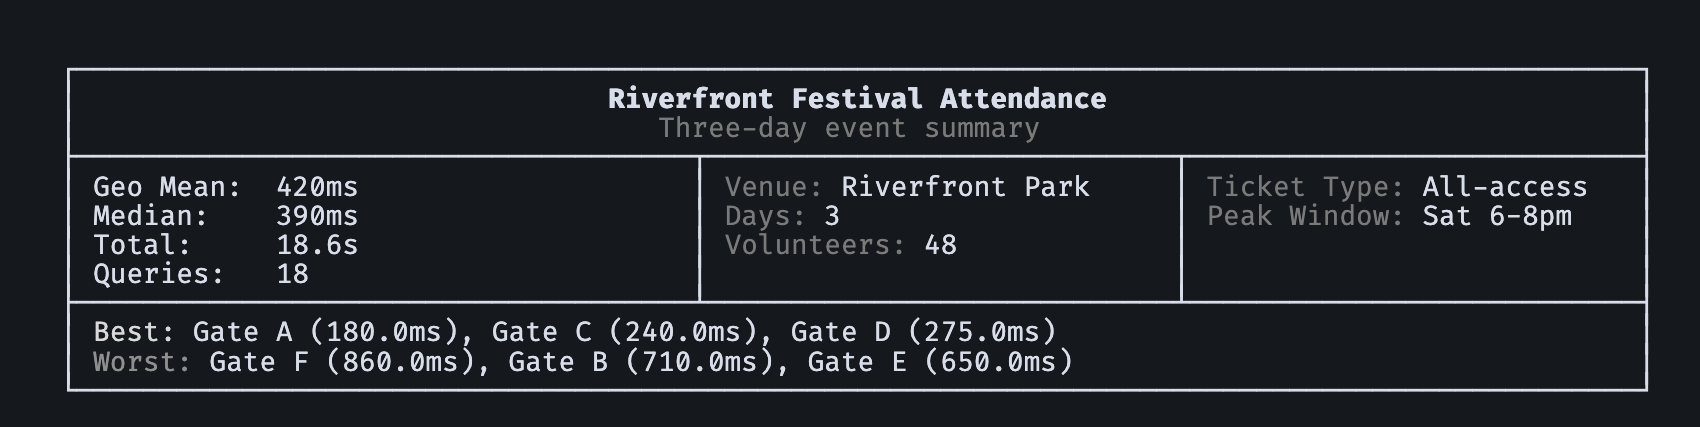
Greyscale
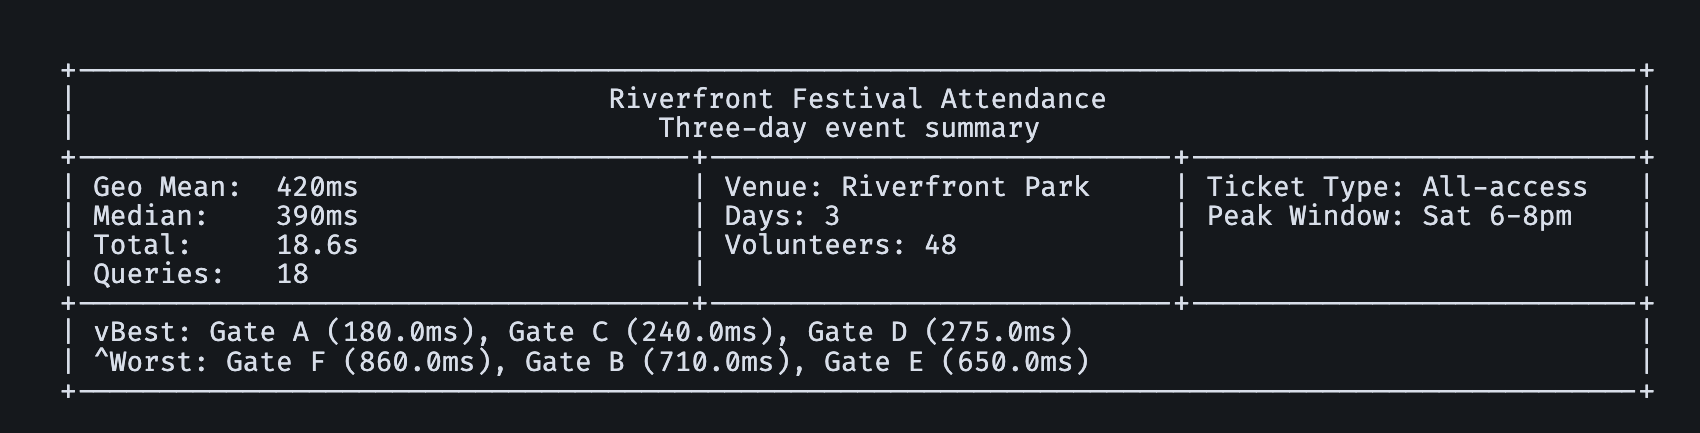
Monochrome
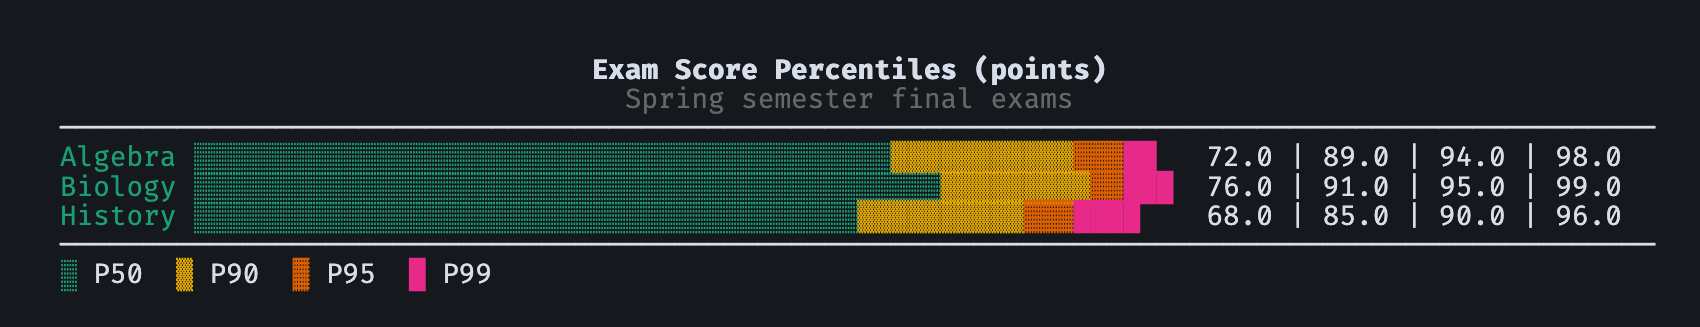
PercentileLadder
Color
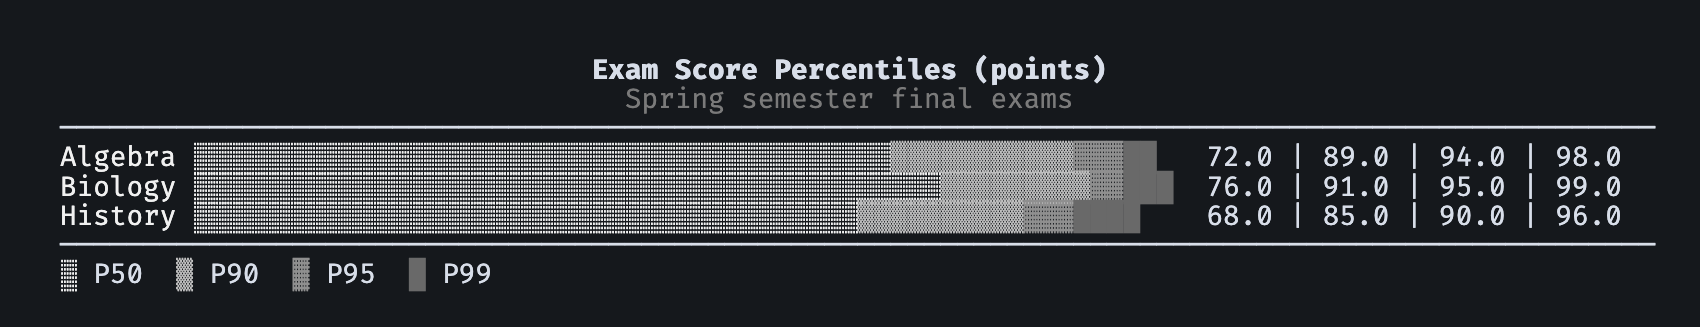
Greyscale
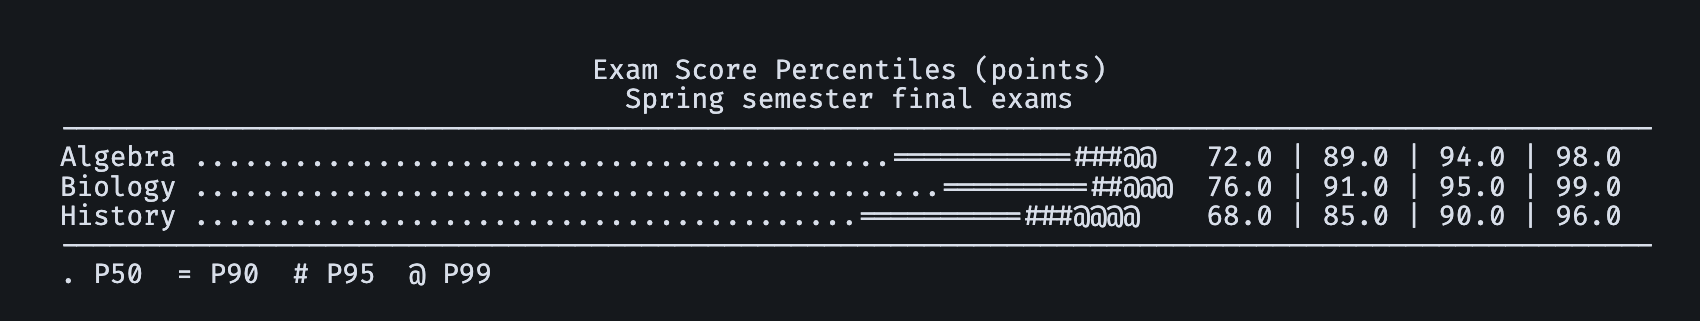
Monochrome
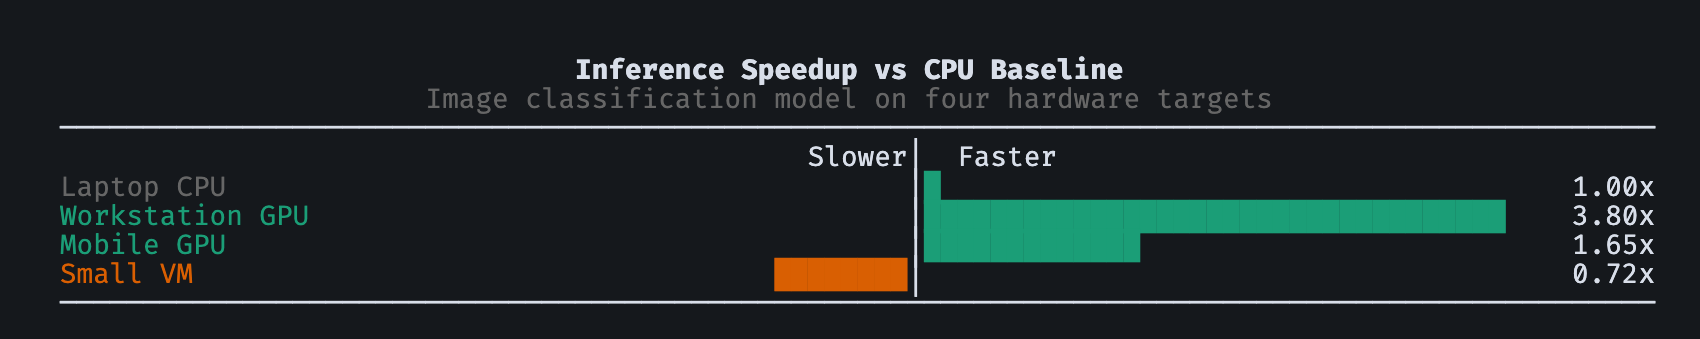
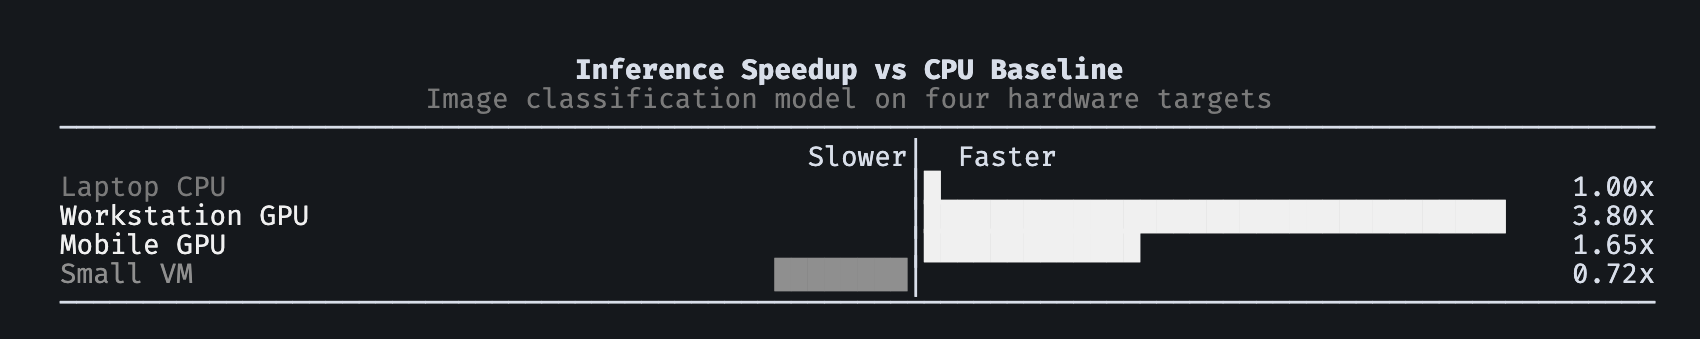
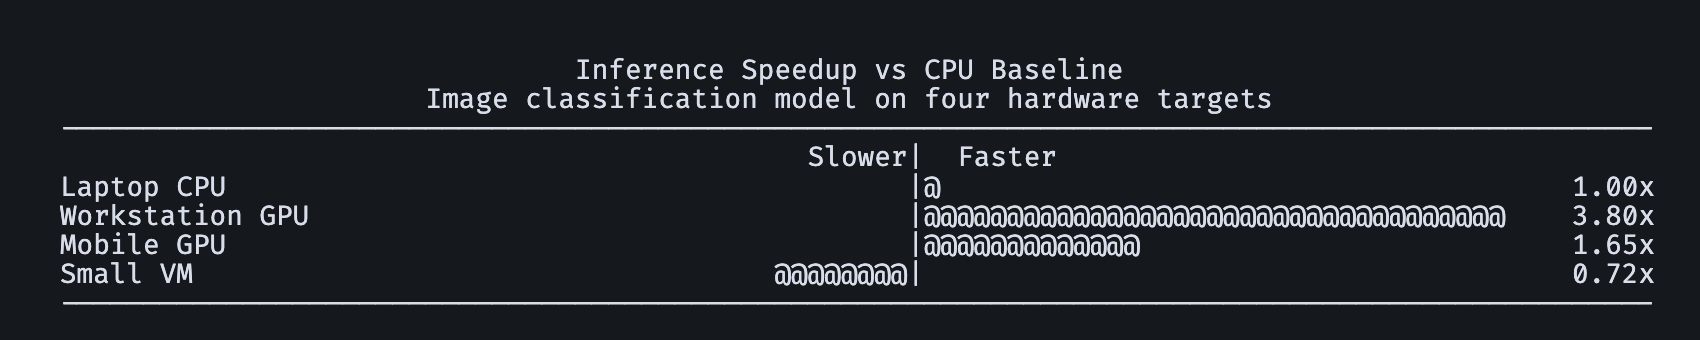
NormalizedSpeedup
Color
Greyscale
Monochrome
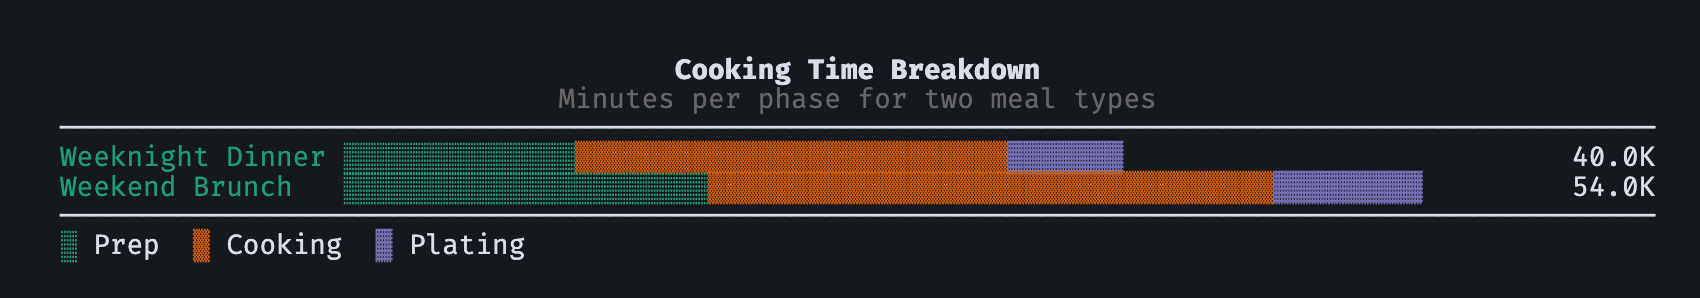
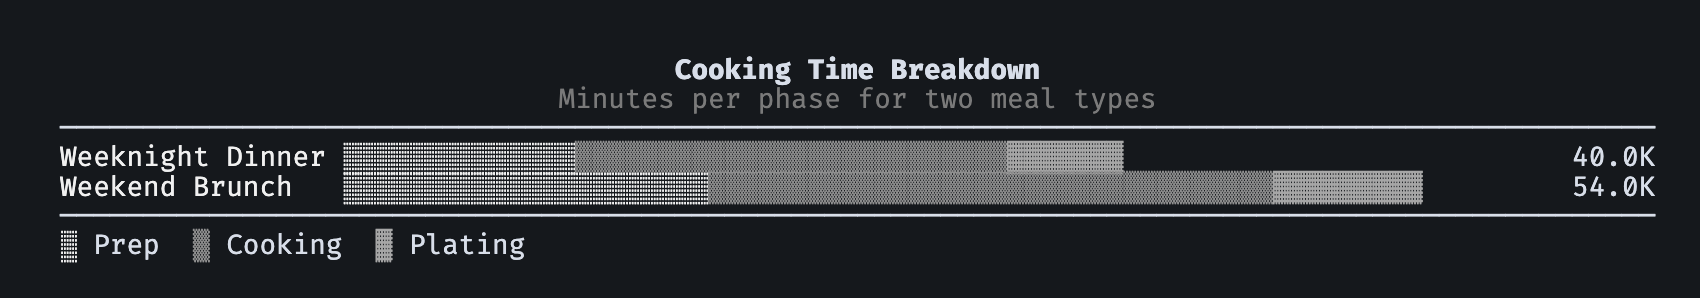
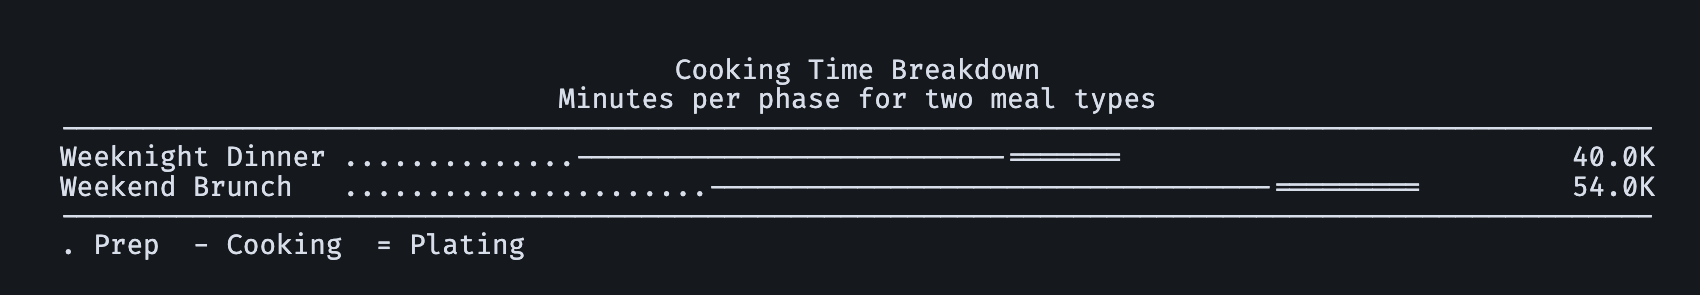
StackedBar
Color
Greyscale
Monochrome
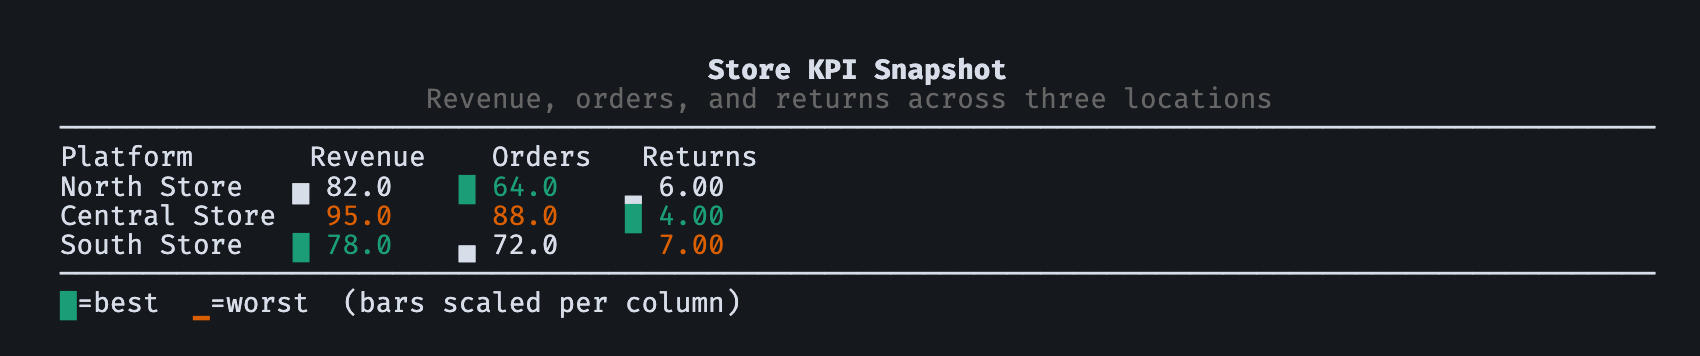
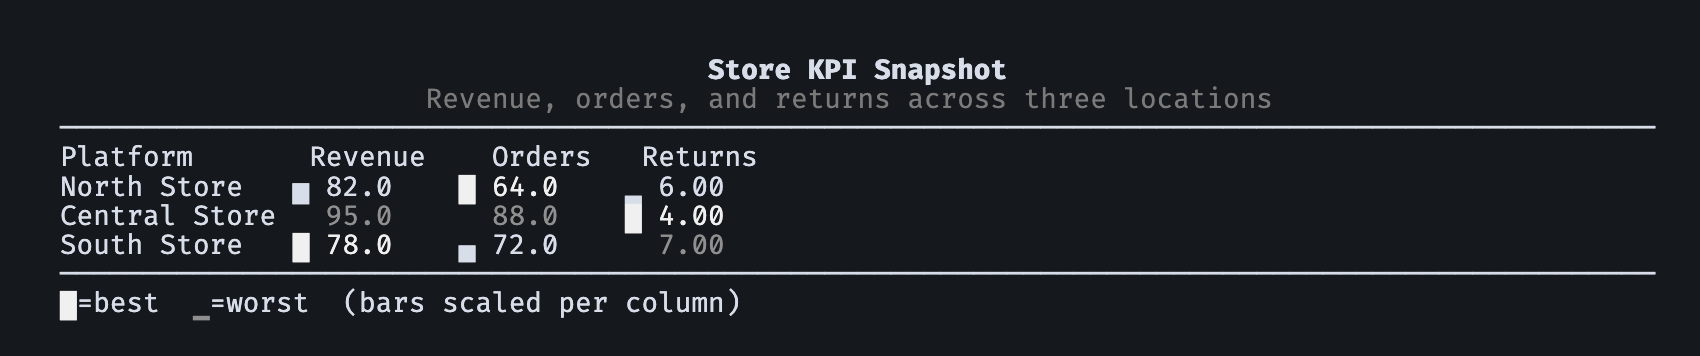
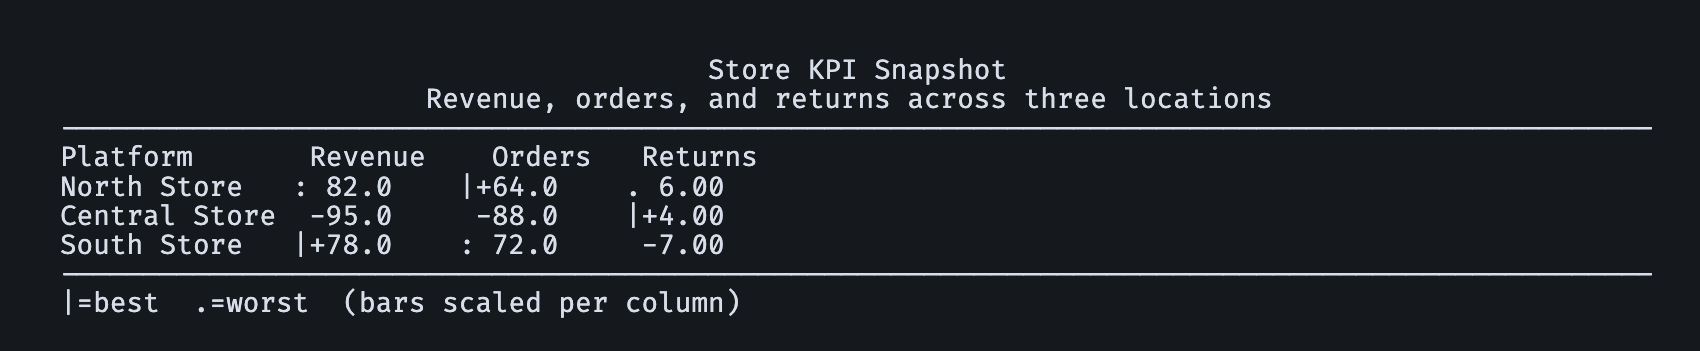
SparklineTable
Color
Greyscale
Monochrome
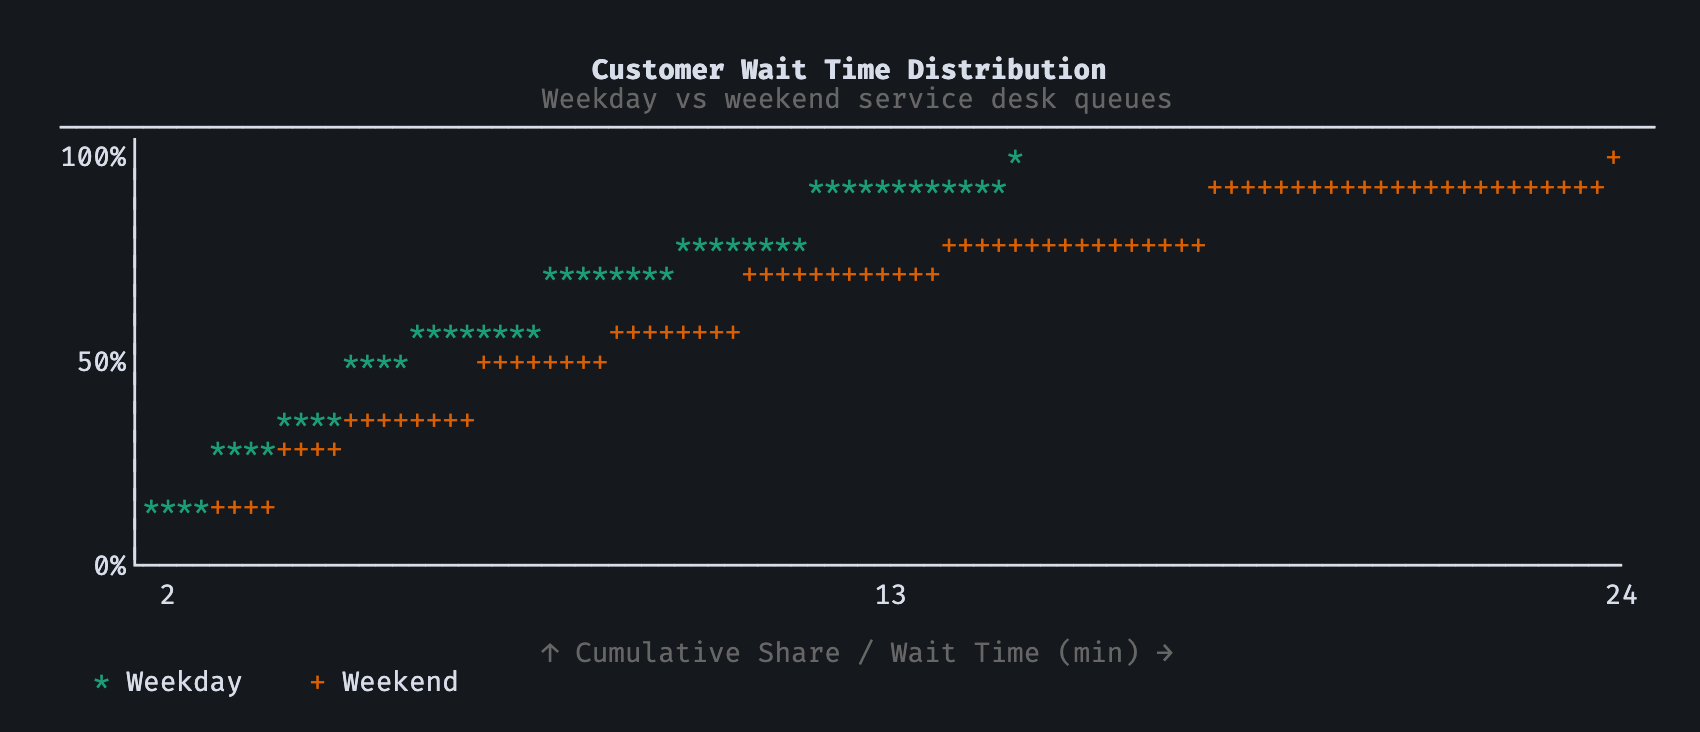
CDFChart
Color
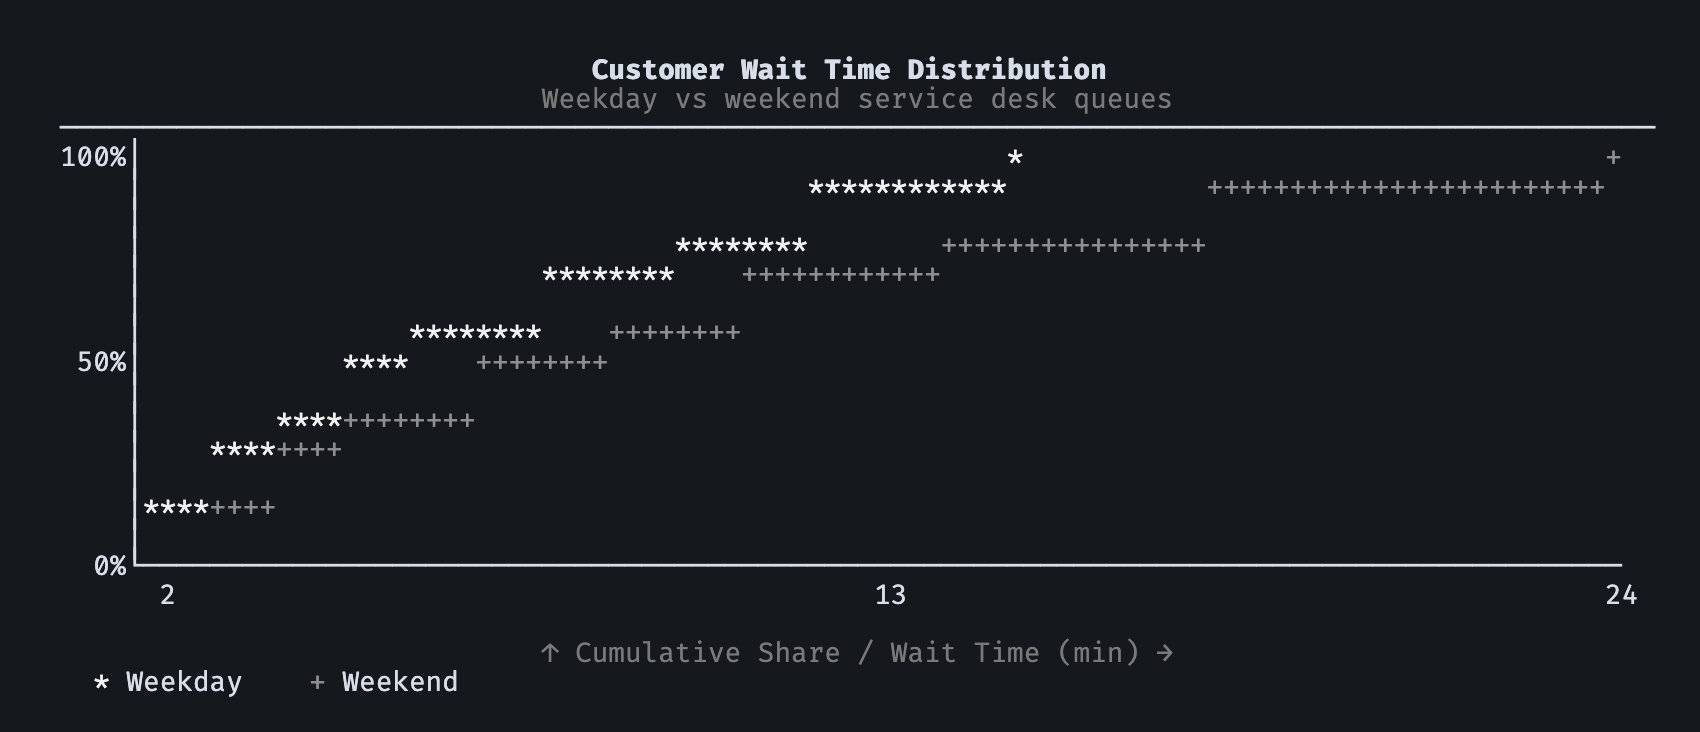
Greyscale
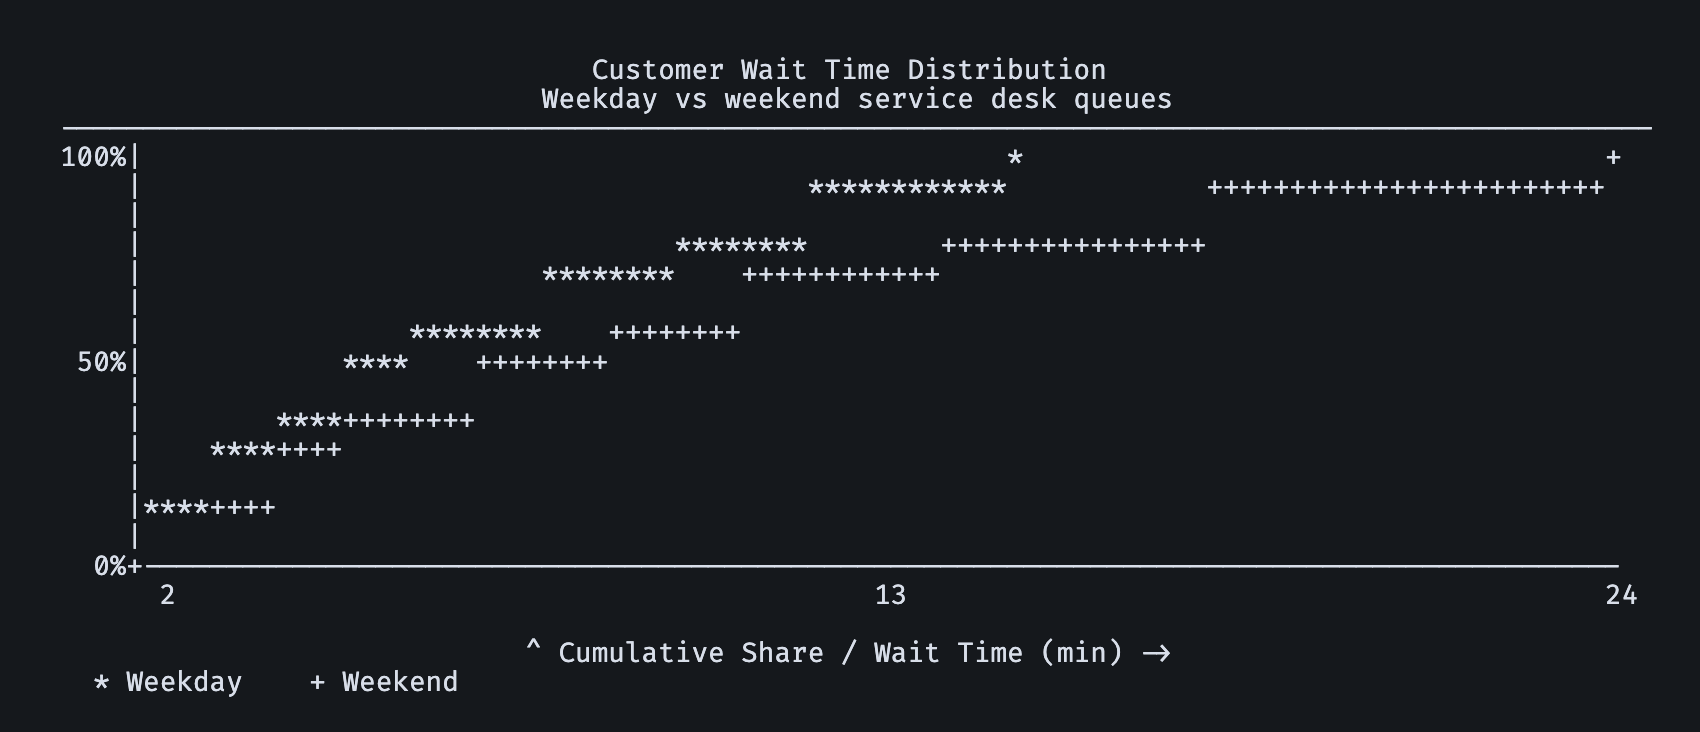
Monochrome
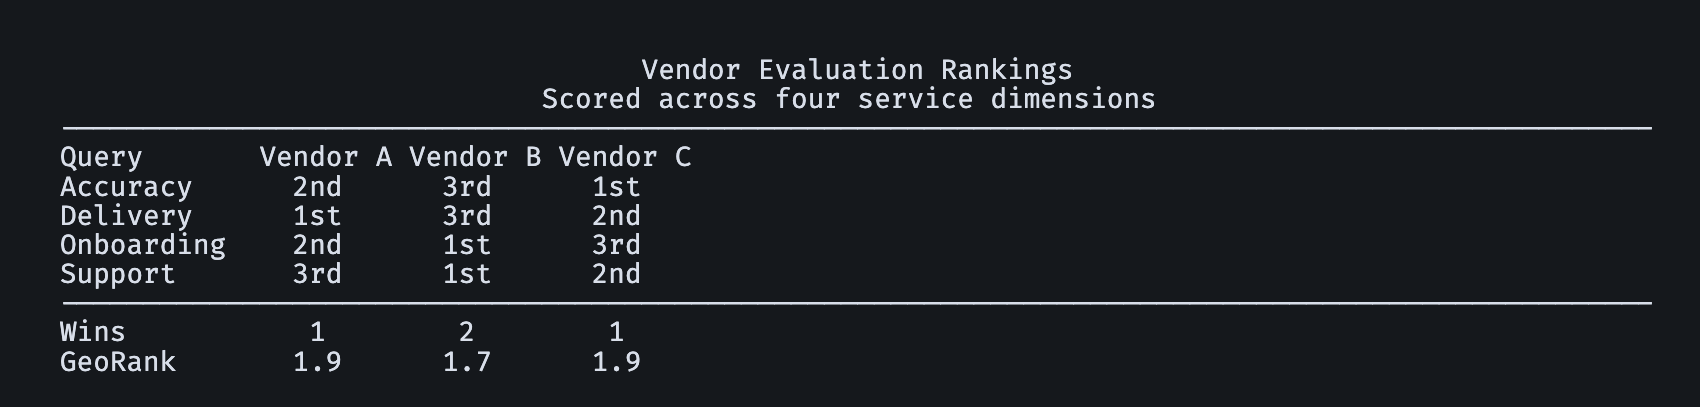
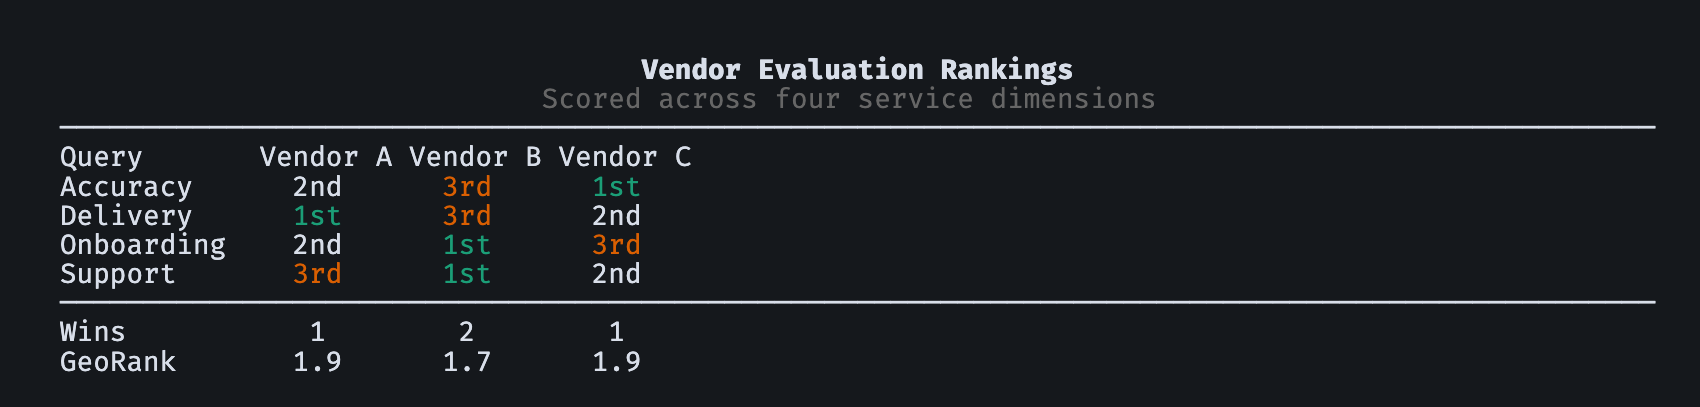
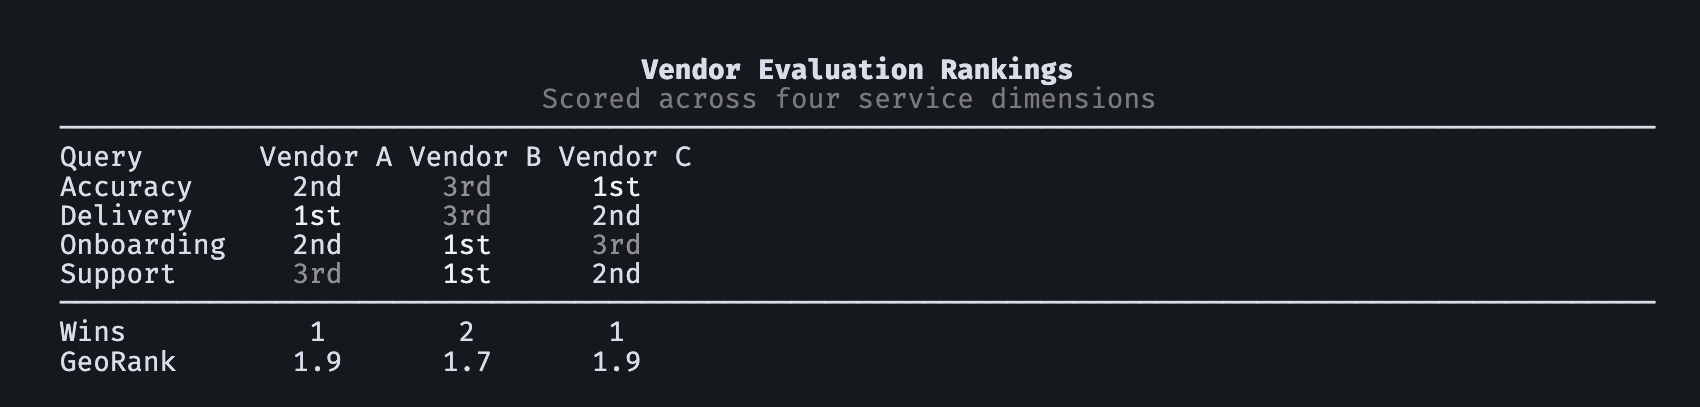
RankTable
Color
Greyscale
Monochrome